Analyzing Heroku Router Logs with SolarWinds Loggly

What are some common problems that can be detected with the handy router logs on Heroku? We’ll explore them and show you how to address them easily with SolarWinds® Loggly® log management.
One of the first cloud platforms, Heroku is a popular platform as a service (PaaS) that has been in development since June 2007. It allows developers and DevOps specialists to easily deploy, run, manage, and scale applications written in Ruby, Node.js, Java, Python, Clojure, Scala, Go, and PHP.
To learn more about Heroku, head to the Heroku Architecture documentation.
Intro to Heroku Logs
Logging in Heroku is modular, similar to gathering system performance metrics. Logs are time-stamped events that can come from any of the processes running in all application containers (Dynos), system components, or backing services. Log streams are aggregated and fed into the Logplex—a high-performance, real-time system for log delivery into a single channel.
Run-time activity, as well as dyno restarts and relocations, can be seen in the application logs. This will include logs generated from within application code deployed on Heroku, services like the web server or the database, and the app’s libraries. Scaling, load, and memory usage metrics, among other structural events, can be monitored with system logs. System logs collect messages about actions taken by the Heroku platform infrastructure on behalf of your app. These are two of the most recurrent types of logs available on Heroku.
To fetch logs from the command line, we can use the heroku logs command. More details on this command, such as output format, filtering, or ordering logs, can be found in the Logging documentation of Heroku Devcenter.
$ heroku logs
2018-09-16T15:13:46.677020+00:00 app[web.1]: Processing PostsController#index (for 208.39.138.12 at 2018-09-16 15:13:46) [GET]
2018-09-16T15:13:46.677902+00:00 app[web.1]: Rendering posts/index
2018-09-16T15:13:46.698234+00:00 app[web.1]: Completed in 74ms (View: 31, DB: 40) | 200 OK [https://myapp.heroku.com/]
2018-09-16T15:13:46.723498+00:00 heroku[router]: at=info method=GET path="/posts" host=myapp.herokuapp.com" fwd="204.204.204.204" dyno=web.1 connect=1ms service=18ms status=200 bytes=975
Heroku Router Logs
Router logs are a special case of logs that exist somewhere between the application logs and the system logs and are not fully documented on Heroku’s website at the time of writing. They carry information about HTTP routing within Heroku’s Common Runtime, which manages dynos isolated in a single multi-tenant network. Dynos in this network can only receive connections from the routing layer. These routes are the entry and exit points of all web apps or services running on Heroku dynos.
Tail router-only logs with the heroku logs -tp router CLI command.
$ heroku logs -tp router
2018-08-09T06:24:04.621068+00:00 heroku[router]: at=info method=GET path="/db" host=quiet-caverns-75347.herokuapp.com request_id=661528e0-621c-4b3e-8eef-74ca7b6c1713 fwd="104.163.156.140" dyno=web.1 connect=0ms service=17ms status=301 bytes=462 protocol=https
2018-08-09T06:24:04.902528+00:00 heroku[router]: at=info method=GET path="/db/" host=quiet-caverns-75347.herokuapp.com request_id=298914ca-d274-499b-98ed-e5db229899a8 fwd="104.163.156.140" dyno=web.1 connect=1ms service=211ms status=200 bytes=3196 protocol=https
2018-08-09T06:24:05.002308+00:00 heroku[router]: at=info method=GET path="/stylesheets/main.css" host=quiet-caverns-75347.herokuapp.com request_id=43fac3bb-12ea-4dee-b0b0-2344b58f00cf fwd="104.163.156.140" dyno=web.1 connect=0ms service=3ms status=304 bytes=128 protocol=https
2018-08-09T08:37:32.444929+00:00 heroku[router]: at=info method=GET path="/" host=quiet-caverns-75347.herokuapp.com request_id=2bd88856-8448-46eb-a5a8-cb42d73f53e4 fwd="104.163.156.140" dyno=web.1 connect=0ms service=127ms status=200 bytes=7010 protocol=https
Heroku routing logs always start with a timestamp and the heroku[router] source/component string, and then a specially formatted message. This message begins with either at=info, at=warning, or at=error (log levels). Each log message will then contain up to 14 other detailed fields, including:
| Field | Description |
| Heroku error “code” (Optional) | For all errors and warning, and some info messages, these are Heroku-specific error codes that complement the HTTP status codes |
| Error “desc” (Optional) | Description of the error, paired to the codes above |
| HTTP request “method” e.g. GET or POST | May be related to some issues |
| HTTP request “path” | URL location for the request, useful for knowing where to check on the application code |
| HTTP request “host” | Host header value |
| Heroku HTTP Request ID | Can be used to correlate router logs to application logs |
| HTTP request “fwd” | X-Forwarded-For header value |
| Which “dyno” serviced the request | Useful for troubleshooting specific containers |
| “Connect” time (ms) | spent establishing a connection to the web server(s) |
| “Service” time (ms) | spent proxying data between the client and the web server(s) |
| HTTP response code or “status” | Very informative in case of issues |
| Number of “bytes” | transferred in total for this web request |
Common problems observed with router logs
Examples are color-coded in this article. Typical ways to address the issues shown above are also provided for context.
Common HTTP status codes
404 Not Found
Trying to access nonexistent paths (regardless of HTTP method):
2018-07-30T17:10:18.998146+00:00 heroku[router]: at=info method=POST path="/cowsay" host=heroku-app-log.herokuapp.com request_id=e5634f81-ec54-4a30-9767-bc22365a2610 fwd="187.220.208.152" dyno=web.1 connect=0ms service=15ms status=404 bytes=32757 protocol=https
2018-07-27T22:09:14.229118+00:00 heroku[router]: at=info method=GET path="/irobots.txt" host=heroku-app-log.herokuapp.com request_id=7a32a28b-a304-4ae3-9b1b-60ff28ac5547 fwd="187.220.208.152" dyno=web.1 connect=0ms service=31ms status=404 bytes=32769 protocol=https
Solution: Implement or change those URL paths in the application, or add the missing files.
500 Server Error
When there’s a bug in the application:
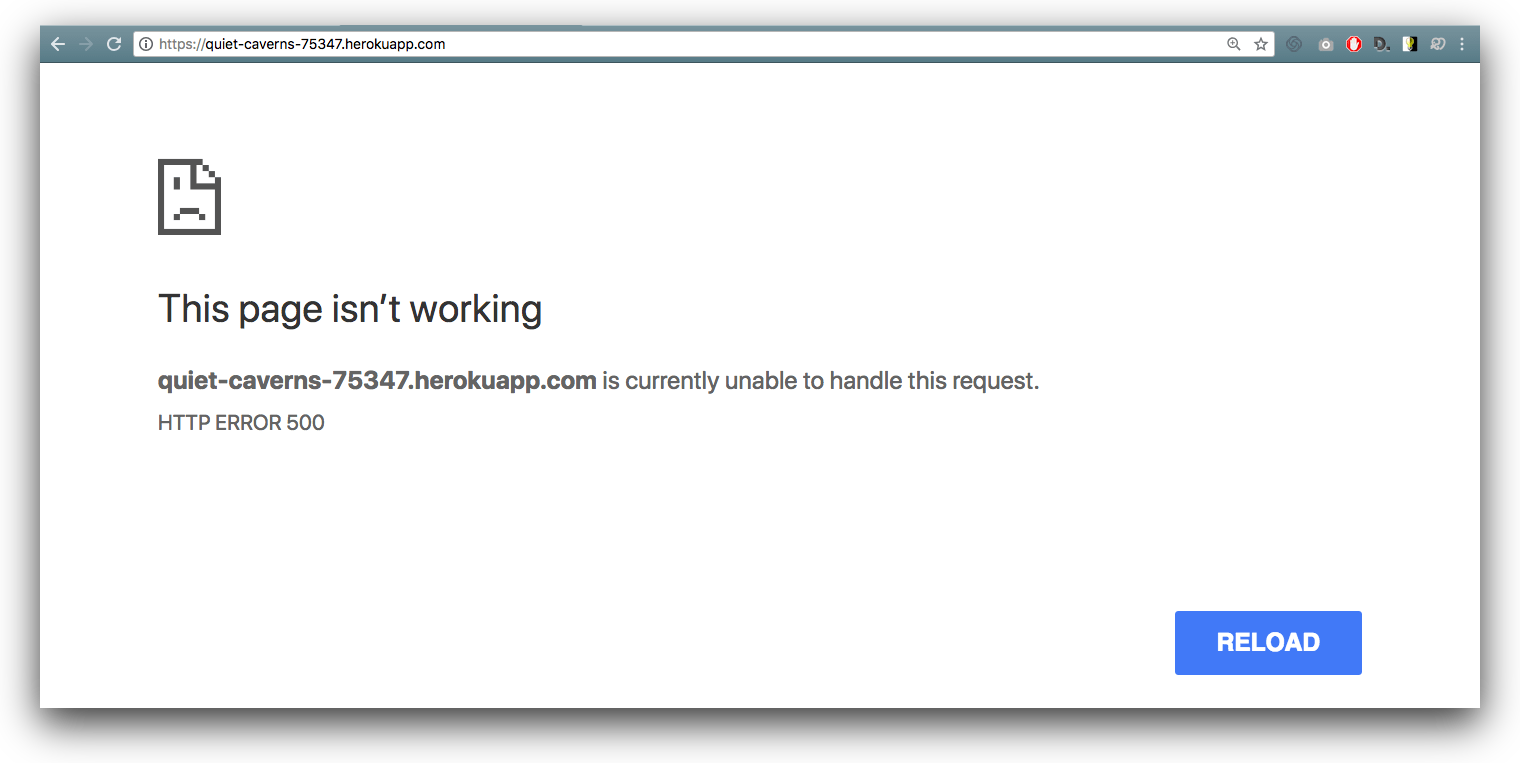
2018-07-31T16:56:25.885628+00:00 heroku[router]: at=info method=GET path="/" host=heroku-app-log.herokuapp.com request_id=9fb92021-6c91-4b14-9175-873bead194d9 fwd="187.220.247.218" dyno=web.1 connect=0ms service=3ms status=500 bytes=169 protocol=https
Solution: The application logs have to be examined to determine the cause of the internal error in the application’s code. Note that HTTP Request IDs can be used to correlate router logs against the web dyno logs for that same request.
Common Heroku Error Codes
Other problems commonly detected by router logs can be explored in the Heroku Error Codes. Unlike HTTP codes, these error codes are not standard and only exist in the Heroku platform. They give more specific information on what may be producing HTTP errors.
H14 – No web dynos running
When our app has no web dynos setup:
2018-07-30T18:34:46.027673+00:00 heroku[router]: at=error code=H14 desc="No web processes running" method=GET path="/" host=heroku-app-log.herokuapp.com request_id=b8aae23b-ff8b-40db-b2be-03464a59cf6a fwd="187.220.208.152" dyno= connect= service= status=503 bytes= protocol=https
Notice that the above case is an actual error message, which includes both Heroku error code H14 and a description. HTTP 503 means “Service currently unavailable”.
Note that Heroku router error pages can be customized—these apply only to errors where the app doesn’t respond to a request such as 503.
Solution: Use the heroku ps:scale command to start the app’s web server(s).
H12 – Request timeout
When there’s a request timeout (app takes more than 30 seconds to respond):
2018-08-18T07:11:15.487676+00:00 heroku[router]: at=error code=H12 desc="Request timeout" method=GET path="/sleep-30" host=quiet-caverns-75347.herokuapp.com request_id=1a301132-a876-42d4-b6c4-a71f4fe02d05 fwd="189.203.188.236" dyno=web.1 connect=1ms service=30001ms status=503 bytes=0 protocol=https
Error code H12 means that the app took over 30 minutes to respond to the Heroku router.
Solution: Code that requires more than 30 seconds must run asynchronously (for example, as a background job) in Heroku. For more info read Request Timeout in the Heroku DevCenter.
H18 – Server Request Interrupted
This error is encountered when the app faces too many requests (server overload):
2018-07-31T18:52:54.071892+00:00 heroku[router]: sock=backend at=error code=H18 desc="Server Request Interrupted" method=GET path="/" host=heroku-app-log.herokuapp.com request_id=3a38b360-b9e6-4df4-a764-ef7a2ea59420 fwd="187.220.247.218" dyno=web.1 connect=0ms service=3090ms status=503 bytes= protocol=https
Solution: This problem may indicate that the application needs to be scaled up, or the app performance improved.
H80 – Maintenance mode
Maintenance mode generates an info router log with error code
H18: 2018-07-30T19:07:09.539996+00:00 heroku[router]: at=info code=H80 desc="Maintenance mode" method=GET path="/" host=heroku-app-log.herokuapp.com request_id=1b126dca-1192-4e98-a70f-78317f0d6ad0 fwd="187.220.208.152" dyno= connect= service= status=503 bytes= protocol=https
Solution: Disable maintenance mode with heroku maintenance:off
Analyzing router logs with Loggly
Loggly is a frustration-free cloud log management service that can aggregate your Heroku app logs, text log files, and syslogs, among many others, in one place. It allows you to monitor, tail, and search logs via a web browser, command-line, or an API. Loggly analyzes log messages to detect trends, and allows you to react instantly with automated alerts.
Provisioning Loggly on your Heroku apps is extremely easy. Just use a drain to send your Heroku application logs to Loggly. Run the below command to send logs:
$ heroku drains:add https://logs-01.loggly.com/bulk/TOKEN/tag/heroku --app HEROKU_APP_NAME
Replace:
- TOKEN: your customer token from the source setup page
- HEROKU_APP_NAME: the name of your Heroku application
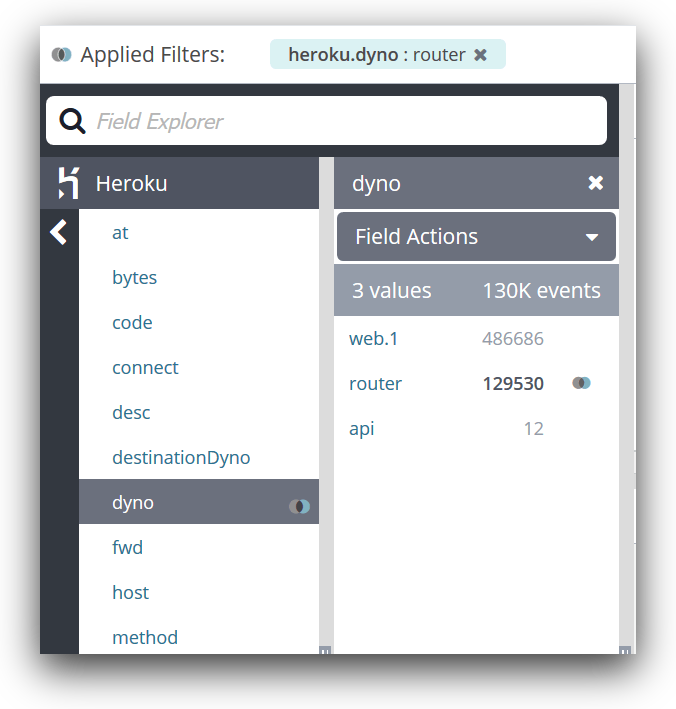
Now you can find Heroku logs easily using the Loggly Dynamic Field Explorer™. Just click on the Heroku logo to see all the fields that Loggly has automatically parsed. You can also filter down to see just router logs by clicking on the dyno field, then clicking the “router” value. Below, we see that almost 130,000 events are coming from the Heroku router.
Analyzing latency in Loggly
Loggly is a great tool to aggregate and analyze logs from any source, including Heroku platform and apps. The Loggly tool’s advantage is that it can perform log metrics analysis, such as latency over time. This is useful to monitor your application performance, leveraging Heroku router logs.
To do this, log into Loggly and then head to the Source Setup screen to find the Heroku button. Click on it and follow the instructions in the next screen, which typically take a couple minutes to complete. There’s more information at the Heroku page in the Loggly documentation.
Loggly recognizes Heroku logs and automatically parses all the fields in the log message format. We can then easily filter Heroku router logs using the heroku.dyno:router field (and heroku.host if there’s more than one Heroku app) in the Loggly Search screen.
To analyze the latency, we can use the router logs heroku.service field (ms proxying data between the client and the web server). Again, this is made easy by the Filter Actions provided automatically by the Loggly Search:
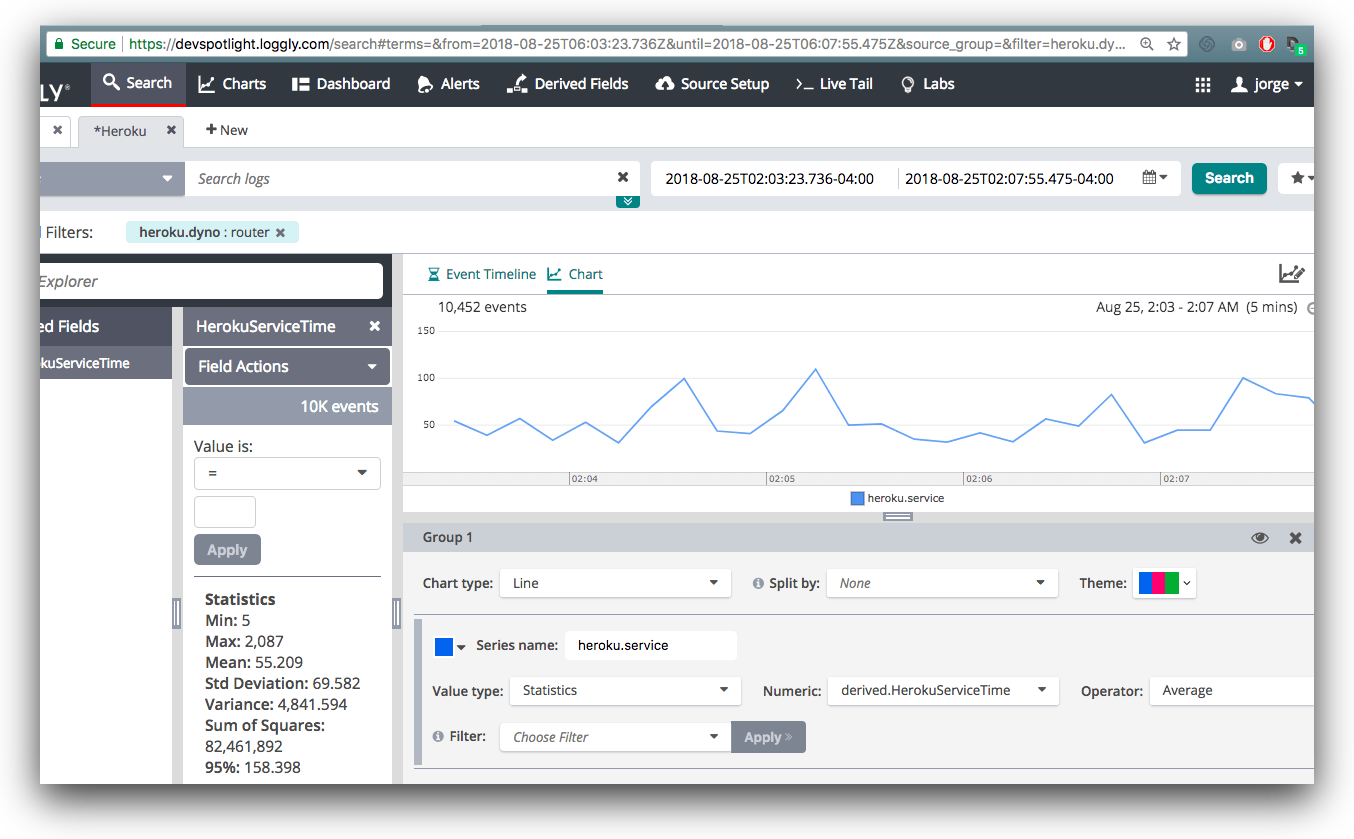
A sustained rise in latency could indicate that your infrastructure is being pushed to the limit due to higher capacity needs, that you deployed a less efficient version of the code, that your database is constrained, or more. To troubleshoot this, you can check your logs to see how much traffic is being processed, when deploys were made, or even query timeouts.
Alert on server errors
Server errors can give users a poor experience and prevent them from using your application. They can also indicate critical bugs in your application, or breakdowns in your infrastructure and supporting services. If your application has a large number of server errors, you need to know quickly.
With Loggly, setting up an alert to monitor the amount of 500s returned by your app is easy and convenient. One way to do it is to filter on status equals 500 in the Field Explorer, and then click on the Add Alert button:
This will bring up the Create an Alert window:

The next screen will give us the alert delivery options, such as email or a Slack message. Now your team will know right away when there is a critical production issue.
Conclusion
Heroku router logs are the glue between web traffic and (sometimes intangible) errors in your application code. It makes sense to give them special focus when monitoring a wide range of issues because they often indicate customer-facing problems to avoid or address ASAP. You can connect a Heroku log drain to Loggly to perform advanced analysis on these router logs. SolarWinds Loggly offers a 14-day free trial to enjoy advanced log management and monitoring tools that allow you to solve any issues arising from web apps efficiently and in a timely manner.
The Loggly and SolarWinds trademarks, service marks, and logos are the exclusive property of SolarWinds Worldwide, LLC or its affiliates. All other trademarks are the property of their respective owners.

Jorge Orpinel