Analyzing Amazon ELB Logs in SolarWinds Loggly
Amazon Elastic Load Balancing (ELB) is an AWS service that distributes incoming web traffic across your Amazon EC2 instances. ELB enhances user experience by providing increased fault tolerance, and helps you handle traffic peaks by allowing you to scale your EC2 instances horizontally with AWS log monitoring.
In addition to traffic routing, Amazon ELB continuously monitors unhealthy EC2 instances. If it detects any unhealthy instances, it reroutes all traffic to the healthy instances until the unhealthy ones recover. Some advantages of ELB include EC2 Auto Scaling, SSL offloading, and the ability to be provisioned via CloudFormation.
The SolarWinds® Loggly® solution provides a Loggly preconfigured dashboard for Amazon ELB, which visually tracks information that is important to a DevOps or SRE professional. This dashboard is available during trials and to Enterprise, Pro, and Standard customers, so you can start getting insight immediately.

Preconfigured dashboard overview
The dashboard is preconfigured with the key ELB metrics that a system operations or DevOps professional might be interested in. Let’s take a closer look at each one.
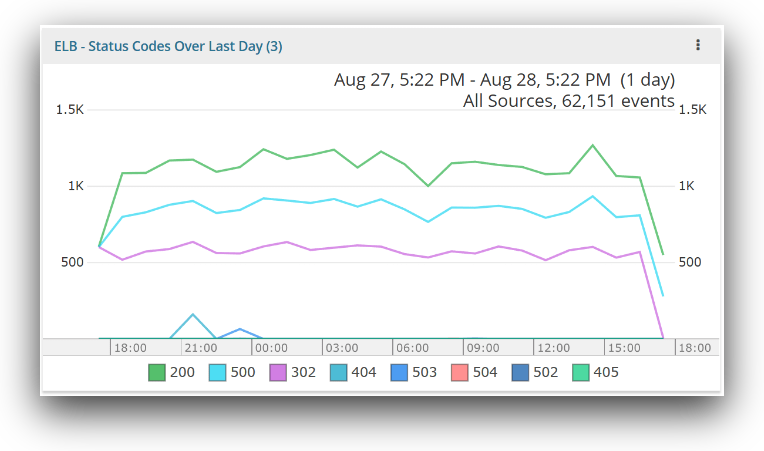
ELB status codes over the last day
Amazon ELB logs contain HTTP error codes, which help in identifying how many requests are returning successfully. They also help to identify the types of errors that occur, and whether they are being generated by the load balancer or the registered backend instances. The list of ELB status codes can be found here.
Status codes over time
This line chart shows you ELB errors (as HTTP status codes) over time. The errors can be due to malformed requests or internal server errors. The line chart gives you a glimpse of the status codes so you can easily analyze the pattern of errors over time. A sudden change in the number of requests over time could indicate changes in traffic. A change in only the number of errors could indicate a problem with your web server, particularly after a recent deployment or a failure of dependent systems.
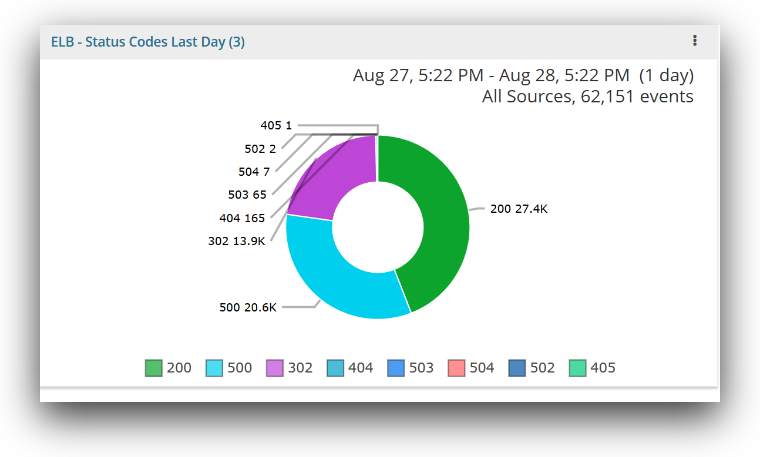
Status code pie chart
This chart gives you a detailed view of HTTP status codes; you can see the count of each status according to the status code. It offers a visual approximation to the percentage of requests that are completing successfully. Typically, you would want the percentage of errors to be less than 5%, so the chart below indicates a serious problem.
Errors by client host over the last day
This chart shows the top client hosts that are responsible for errors. There may be various reasons for a particular host to generate those errors; improper requests, mismatched versions, or even misuse of the service are a few. If a large percentage of errors is coming from a small number of client hosts, then a large user could have a misconfiguration or the client code may be out of date. It may be a good idea to reach out to that customer to correct the problem. Below, we can see that the top nine client hosts are only responsible for a small percentage of errors, which indicates the errors are not caused by a specific client host.

Top error requests over the last day
These metrics monitor the top requests that are generating ELB errors by URL and method. They will provide you with information about which resources, like webpages or endpoints, are generating errors. The chart below will help in finding the URL that is giving most of the errors. Below, we see that the errors are fairly uniformly distributed across many URLs. There may be a common route or parameter causing these errors, and you can get more details by clicking on the chart to see the event data.

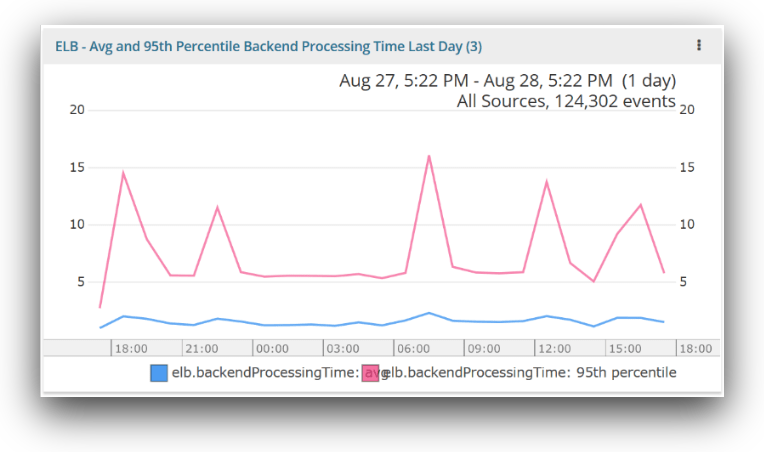
Average and 95th percentile backend processing time over the last day
This graph gives the total elapsed time, in seconds, it takes to send the request to the registered instance from the ELB. Monitoring these metrics will help you detect performance or capacity problems. The average value shows you typical response time, while the 95th percentile shows the effect of outliers. (Read this post for more insight on why you can’t just use averages to measure performance.)
Average request and response size over the last day
This ELB metric monitors the average sent and received bytes through ELB, also commonly referred to as throughput. The sentBytes field represents the response size sent to the client, while the receivedByte field denotes the response size received by the client. The response size is always measured in bytes. These metrics help you identify the network load.
Notice on the chart that ELB sentBytes increased around 17:00. It means ELB is sending more data to the client. A DevOps or SRE could correlate a spike in traffic at a specific time with other issues they might be seeing in the system.

Proactively monitor using alerts
An important part of any log management system is alerting. While a dashboard is helpful at a glance, you probably can’t keep eyes on it all day. An alert is a notification service that proactively notifies your team when a metric meets the condition you define. You can easily create automated alerts on any metric for any group of instances, with triggers tailored precisely to your infrastructure and usage patterns. You can add alerts on ELB logs and send them to any supported endpoint such as email, HipChat, PagerDuty, Slack, and more. Below, you can see an example alert sent over email.

Conclusion
Now you have a good idea how SolarWinds Loggly gives you critical visibility into what’s happening with your load balancers and applications. It helps in visualizing ELB logs using the pre-configured dashboard. You can also receive alerts when the metrics indicate a potential problem. To get started, sign up for a free trial, then follow the steps given in the Loggly S3 ingestion documentation so Loggly can access your logs.
The Loggly and SolarWinds trademarks, service marks, and logos are the exclusive property of SolarWinds Worldwide, LLC or its affiliates. All other trademarks are the property of their respective owners.

Jason Skowronski