Quick and Easy Monitoring of Amazon ELB
Many high-volume applications and websites depend on Amazon Elastic Load Balancing (ELB) to improve their scalability and fault tolerance. In addition to automatically routing traffic across instances and Availability Zones, Amazon ELB detects unhealthy instances and reroutes traffic to the healthy instances that remain.
The Loggly application pack for Classic ELB makes it easier for you to monitor what’s happening with Amazon ELB using log data. It automatically installs a dashboard in your Loggly account showing:
- ELB status codes over the last day
- Errors by client host over the last day
- Top error requests over the last day
- Average and 95th percentile backend processing times over the last day
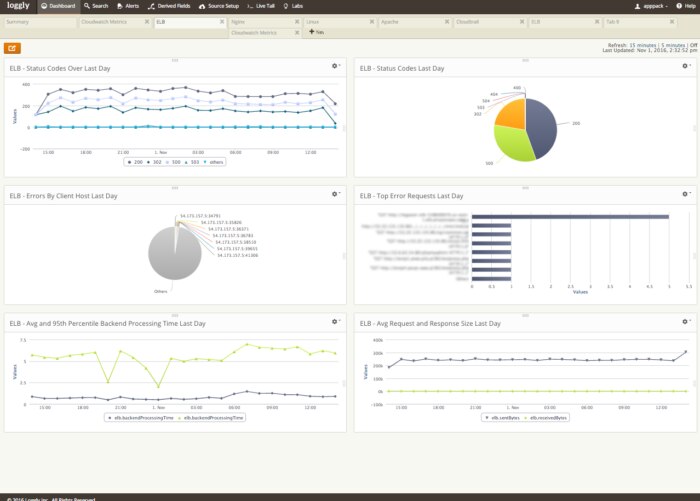
ELB Status Codes over the Last Day
Amazon ELB reports errors as standard HTTP error codes, which can include malformed requests or server errors. If it generates an error, you may have a problem with your code, capacity, timeout settings, or more. You can see a list of error codes for Classic ELB here.
Errors by Client Host over the Last Day
This chart can reveal the top client hosts that are getting errors from the server. If a particular host is generating too many errors, it may be due to improper requests, mismatched versions, or even misuse of the service.
Top Error Requests over the Last Day
This chart shows the top requests that are generating ELB errors by URL and method. It reveals which resources are generating errors, such as webpages or API endpoints, and will help you determine if a significant number of errors are caused by a single page or endpoint, in which case you would want to do a deeper investigation.
Average and 95th Percentile Backend Processing Times over the Last Day
Monitoring these metrics can help you detect performance or capacity problems. Average values give you a quick read on how things are comparing to “normal,” while 95th percentile metrics take out the effect of outliers. (Read this post for more insight on why you can’t just use averages to measure performance.)
Saved Searches for Amazon ELB Simplify Troubleshooting
The ELB application pack also includes saved searches for ELB-related error codes, large payloads, and slow processing times. Looking at this data is a handy way to understand what’s happening with your load balancing.
You can find these saved searches by clicking the star icon to the right of the search button.
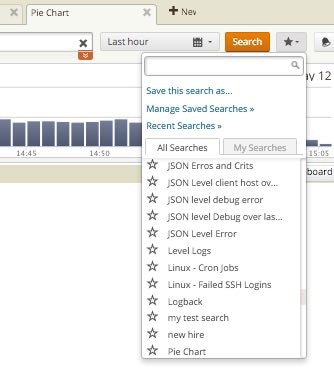
In addition, you can quickly create alerts for any of of your saved searches. For example, you’d want to know right away if error codes or processing times were spiking.
If you’re interested in elastic load balancing see why we chose Amazon Route 53 over Elastic Load Balancing
If your application uses Amazon ELB, the ELB application pack is a quick way to up your monitoring game. And it only takes one click to get started!
The Loggly and SolarWinds trademarks, service marks, and logos are the exclusive property of SolarWinds Worldwide, LLC or its affiliates. All other trademarks are the property of their respective owners.

Jason Skowronski