Using Amazon CloudWatch Metrics with SolarWinds Loggly
Amazon CloudWatch provides metrics and log monitoring for AWS resources like elastic compute (EC2) instances, load balancers like ELB, and more. This data is important to monitor the health of your infrastructure and applications. You can use it to better plan capacity, auto-scale your instances, and even receive alerts when there are problems.
Monitoring your CloudWatch metrics and logs with SolarWinds® Loggly® offers a number of advantages, including the ability to aggregate metrics from AWS resources from multiple clouds, your on-prem resources, and more. It also offers smart features like derived fields, anomaly detection, and Live Tail.
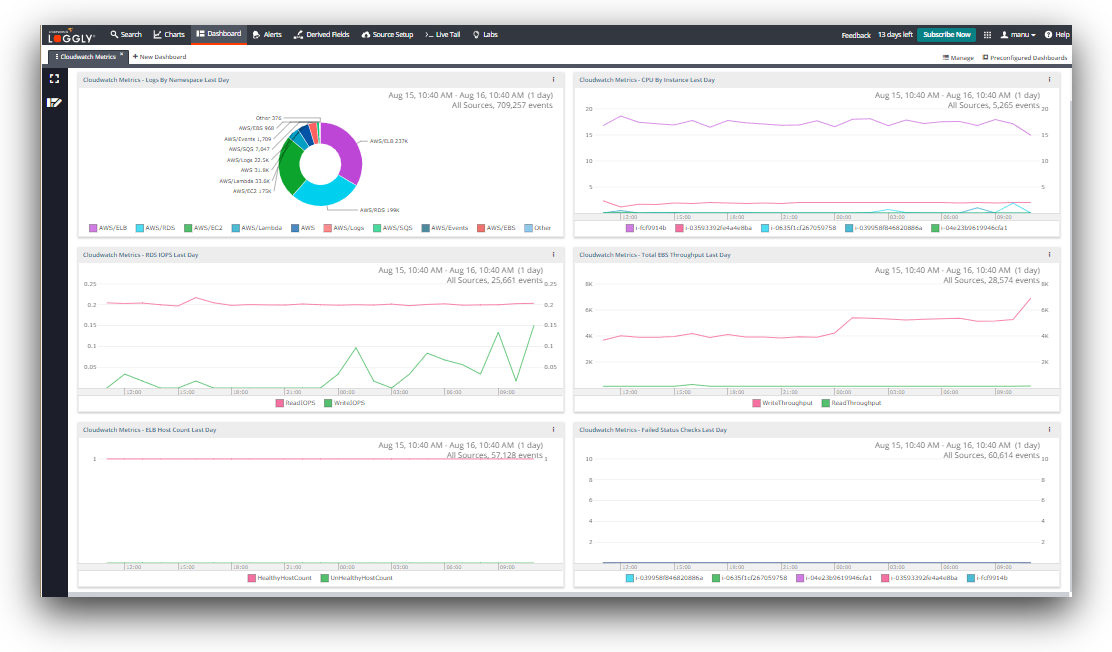
Amazon CloudWatch metrics are monitored in the Loggly preconfigured dashboard, which visually tracks the metrics from AWS CloudWatch. This dashboard is available for Standard subscriptions and above, so you can immediately get insight. You also have the ability to customize your own dashboards.
Overview of the Metrics
The dashboard is preconfigured with the important metrics that an SRE might be interested in. Let’s take a closer look at each one.
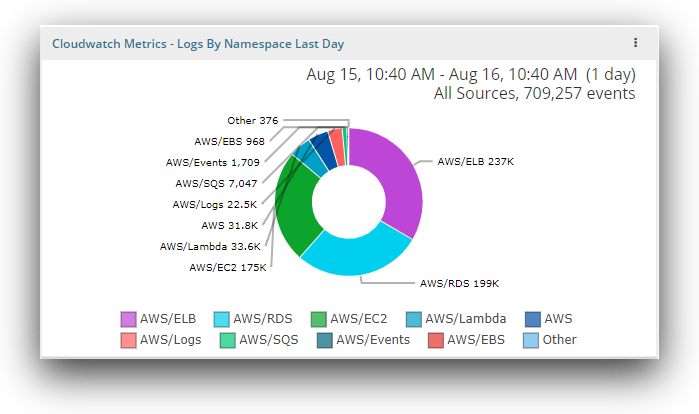
Logs by namespaces
The chart showing logs by namespace offers a detailed view of how many events the different AWS services are creating each day. This is a good way to get an overview of the types of service metrics that are available in your account.
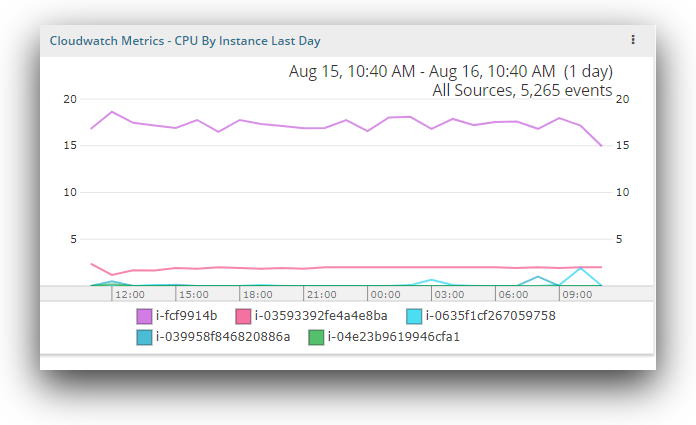
CPU by instance
This chart shows CPU use by individual instances. CPU utilization provides details on the processing power required to run an application on a selected instance. If you notice an instance that is running high on CPU consistently, there may be a problem on the machine or you may be at the limit of the machine’s capacity.
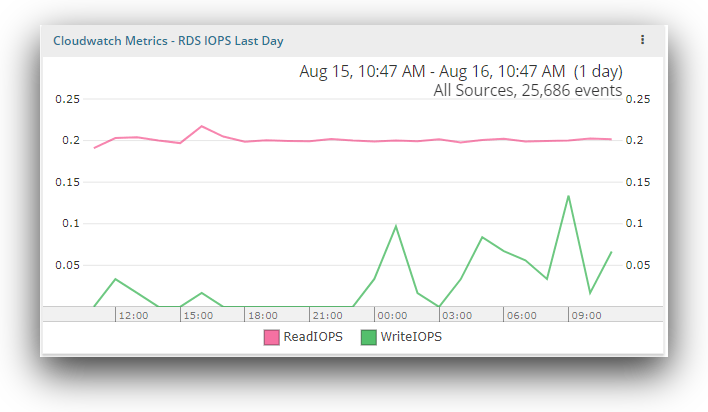
RDS IOPS
The RDS IOPS metric monitors each active database instance every minute. It provides the average number of disk read/write I/O operations per second. It shows the average events for each database instance. If this metric is running high, there may be a change in your application’s query pattern or caching layer.
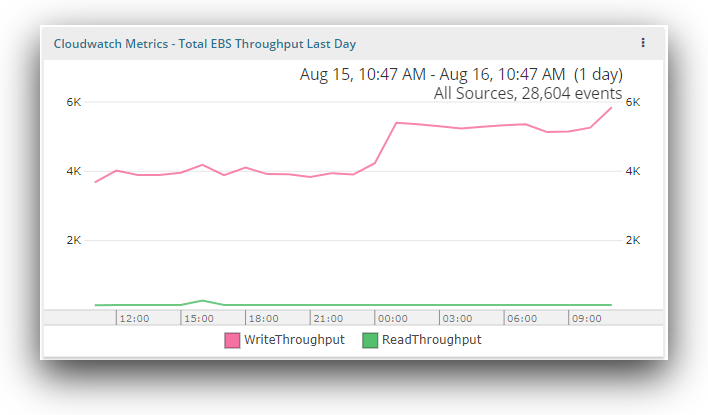
EBS throughput
The CloudWatch metrics for the total EBS throughput for a particular day defines the read and write throughput. The read throughput is the average number of bytes read from the disk per second. The write throughput is the average number of bytes written to the disk per second. Changes here can indicate changes in application load, disk operations, caching, or memory swap usage.
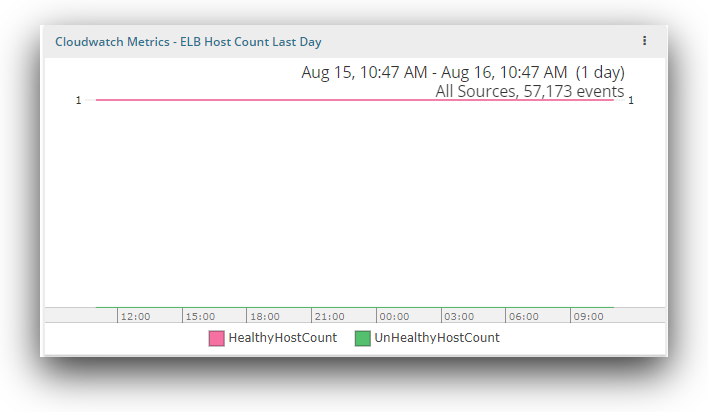
ELB host count
The CloudWatch metric for ELB host count defines the requests flowing through the load balancer. It showcases the number of healthy and unhealthy instances registered with your load balancer. An instance can be defined as healthy or unhealthy on the basis of thresholds configured for health check. If the instance passes the health check and is above the configured threshold, it is considered healthy. A large number of unhealthy hosts could put your application’s availability at risk.
Failed status
This metric shows the instances for which the status check failed. There are various reasons for failure of a status check: failed system status checks, incorrect networking or startup configuration, exhausted memory, etc. If these instances do not recover after a period of time, they may require personal attention.

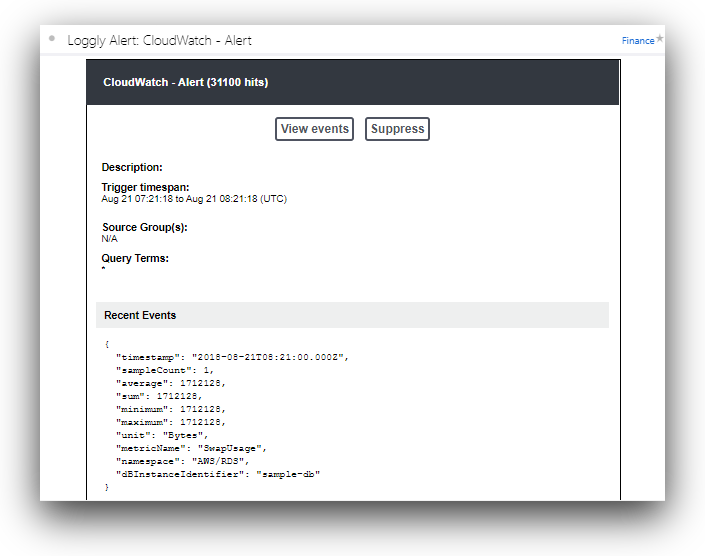
Proactively Monitor Using Alerts
Alerts are an excellent way to proactively notify your team when there is a critical problem. You don’t need to continuously monitor the dashboard because the alerts will notify you. You can create notifications by adding CloudWatch metric alerts and sending them to any supported API endpoint integration, such as email, HipChat, Slack, PagerDuty, VictorOps, or your own Webhook-compatible notification service.
Conclusion
You can send all your CloudWatch metrics to SolarWinds Loggly and get access to preconfigured dashboards as well as powerful alerting capabilities. Loggly can give you better visibility into AWS CloudWatch metrics and help you troubleshoot problems faster. Learn more about the many features of Loggly, such as anomaly detection, Live Tail, and more. To get started, sign up for a free trial and then follow the steps in the Loggly documentation for CloudWatch.
The Loggly and SolarWinds trademarks, service marks, and logos are the exclusive property of SolarWinds Worldwide, LLC or its affiliates. All other trademarks are the property of their respective owners.

Jason Skowronski