Analyzing Jenkins Metrics: Track Broken Builds, Build Time and More
Implementing continuous delivery (CD) is a challenge for organizations of all sizes. It’s not just a matter of generating more builds more often, but of automating and optimizing the release process. To know whether you’ve done CD successfully, you need to understand whether you are checking in your code frequently enough, whether builds are being delivered successfully, and whether you’re making the build and delivery process more efficient.
Why is Tracking Continuous Delivery Important?
As with other DevOps practices, CD is about reliability and speed. The goal is to deliver a production-ready build from source code as quickly as possible, which means automating building, testing, and validation. For many organizations, this process happens multiple times a day, and while not every build will be sent to production, each build should be production-ready. When they are not production-ready, you want to identify the problem quickly so the developer can address it before switching context. The longer it takes to generate a production-ready build, the longer it takes for changes to make it out to customers.
Measuring this process provides insight into how effectively it is working, and whether it can be optimized. Additionally, measuring lets you monitor unexpected or unusual behavior during the build process, such as a failed build.
Collecting metrics on CD helps you:
- Track broken builds: Tracking the build state helps identify build problems as soon as they occur, including the source of the error.
- Optimize the build pipeline: Identifying bottlenecks in the build process lets you optimize the pipeline for faster deliveries.
- Make management decisions: Understanding how changes are impacting builds can help determine how to best allocate resources. For example, if builds are failing too frequently, developers should focus more effort on fixing bugs rather than introducing new features. If they are not checking in code frequently enough, you may not be implementing a true continuous integration process, increasing the risk for future broken builds or delayed releases.
Collecting and Storing Metrics Using Loggly
Using SolarWinds® Loggly®, we can collect logs from a CD pipeline and use them to visualize trends, generate alerts, and monitor for anomalies. To demonstrate this, we deployed a Java-based web application using Jenkins, a popular open-source automation server. We created a pipeline that pulls the project’s source code from GitHub and builds it using Maven. We logged the output of each build using the Job Log Logger Plugin, then used the Syslog Logger Plugin to write each log to the local syslog server. We then forwarded events from the syslog server to Loggly.
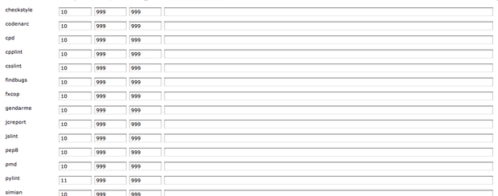
Jenkins logs appear as unparsed text in Loggly, but we can still extract key data points using derived fields. For this example, we used derived fields to extract:
- Build status: Whether the build was a success or a failure
- Build number: The build number that the log is associated with
- Build time: The total time (in seconds) taken to complete the build
- Build error: The cause of a failed build such as an exception or error message
For example, the below event was generated on a successful build. The name of the Jenkins project, build number, and status were automatically parsed by Loggly. The build time and build error fields are generated by other events, and aren’t displayed here:
Aug 20, 2018 2:52:00 PM hudson.model.Run execute#012INFO: Spring-PetClinic #14 main build action completed: SUCCESS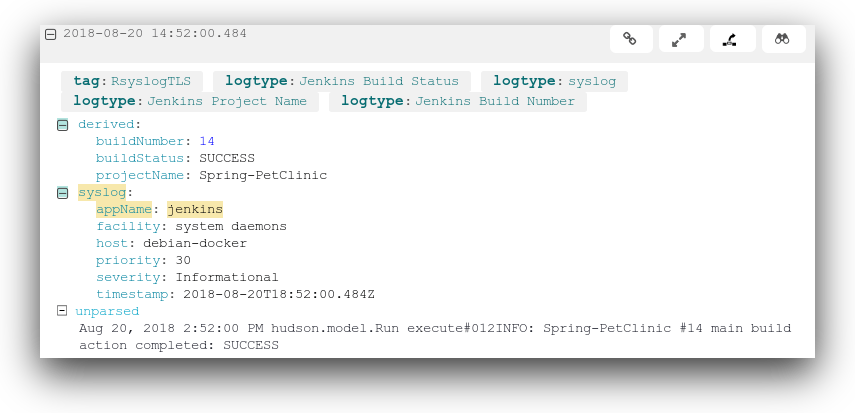
Using these derived fields, we’ll analyze three metrics: delivery frequency, build status, and build time.
Delivery Frequency
With CD, new builds can be scheduled as often as once every few minutes. Tracking the build frequency lets you see how quickly new changes are making their way into the build. In an ideal CD process, each new change merged into the main branch triggers a new build, as this allows each change to be independently tested.
Delivery frequency also highlights any delays in the CD process. A delay could indicate slow compilation times, slow testing times, or even slow development times. The longer it takes for a change to run through the CD pipeline, the longer it takes to identify and address problems, pushing back both the development and release of new changes.
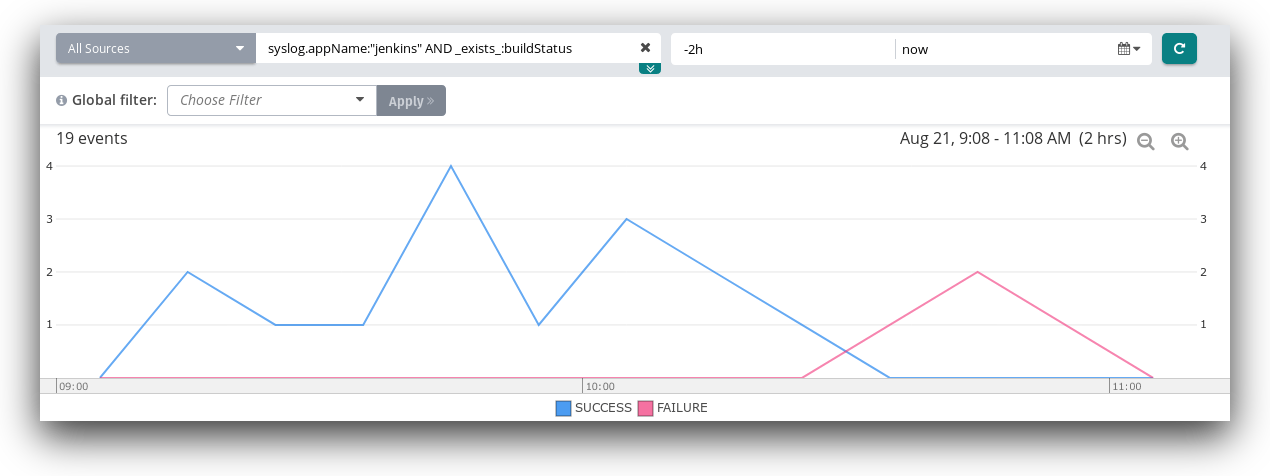
Sending this data to Loggly means we can visualize it using charts. In this example, we created a line chart based on the number of events containing a build status. Since Jenkins only logs the build status at the end of each build, this allows us to see the total number of builds performed over a period of time.
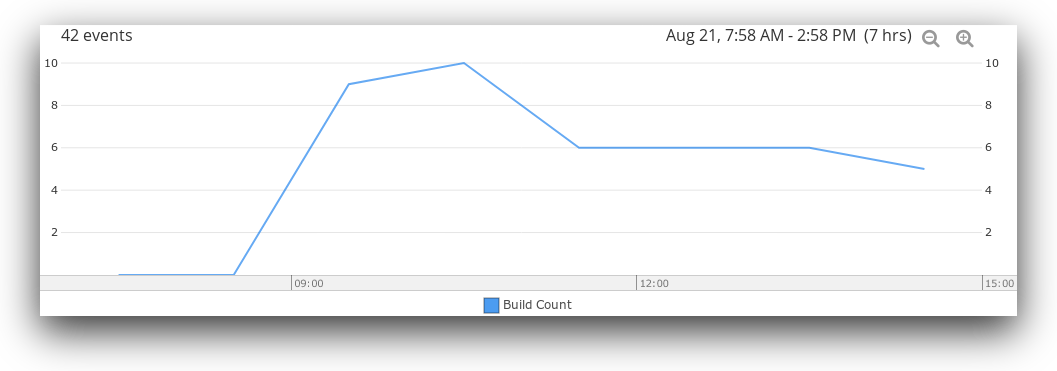
For more granular information, we can filter this chart to only show successful builds, failed builds, or both. Ideally, you would like to see your development team integrating changes several times per day. If it’s weeks between merges, developers may be building up large pull requests on their local environments. Smaller changes are less likely to break, easier to code review, and keep the team in sync.
Build Status
Build failures are inevitable, especially when multiple builds can be generated in a single day. By tracking failures, we can quickly identify the changes that led to the failure and resolve them more quickly than we could otherwise.
A failure raises two important questions: when did the build fail, and why did it fail? By logging each step in the build process, we can monitor for failures and identify the root cause using two of our derived fields: the build status and build error. Although these are logged in two separate events, we can use the Surrounding Events feature on the event containing the build status to find relevant messages. Depending on the application, information about the error can include file names, line numbers, and stack traces.

For a more automated approach, we can create an alert to immediately notify us of a failed build. Alerts can include up to 10 of the most recent events surrounding the failure, providing immediate and useful context without requiring additional searching.
In the following example, we created an alert that sends an email to the DevOps team after detecting any failed builds within the past hour.

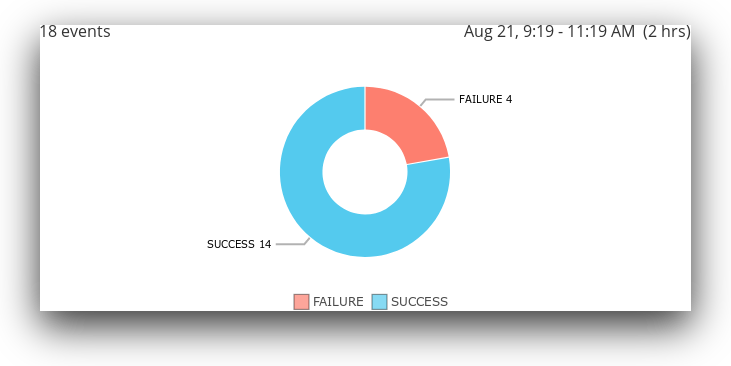
Tracking build status is useful for more than just responding to problems. It shows you how healthy your CD process is, and how effective your developers are at resolving and preventing failures. Using Loggly Charts, we can visualize build health as a total, or show how it has changed over time.
Build Time
Each new build must go through a series of steps including compilation, testing, and validation. Since speed is a major factor in CD, each of these steps must be optimized to ensure changes can be delivered quickly. The longer the build process takes, the longer it takes for changes to make their way into production.
In Jenkins, the total time to complete the build is recorded in the build summary (in seconds):
Aug 21, 2018 11:09:53 AM org.jenkins.ci.plugins.jobloglogger.AbstractBuildJULOutputStream write#012INFO: Spring-PetClinic #53: [INFO] Total time: 49.905 s By storing the build time as a numeric derived field, we can perform calculations and statistical analysis to understand the build process and monitor for abnormalities. If a build ends too quickly or takes too long, it could indicate a problem with the build server or the build pipeline.
Several statistics are available simply by expanding the field in the Loggly Field Explorer.
Statistics
Min: 12.74
Max: 51.202
Mean: 28.117
Std Deviation: 16.167
Variance: 261.371
Sum of Squares: 6,311.732
95%: 50.878
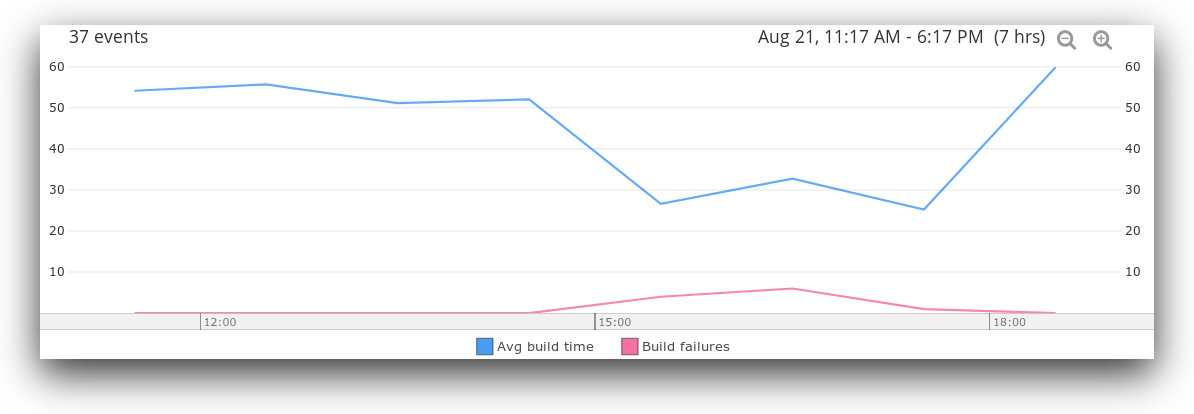
In this example, the wide range of values is due to a relatively high percentage of failed builds. Failures stop the build process early on, skewing the results towards the lower end. As shown in the following chart, an increase in build failures directly correlates with a decrease in the average build time. As more successful builds are completed, the overall average will also increase.
We can use alerts to send a notification if the build time falls far outside of the expected range. For example, the following notification triggers when a build time falls outside the 99th percentile:
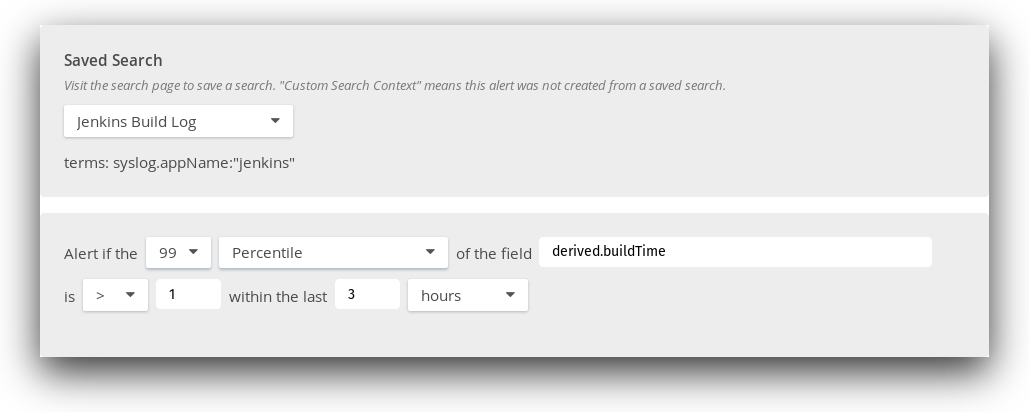
Creating an alert that triggers on detection of an event with a build time in the 99th percentile.
Continuous delivery is difficult to do well, but it has significant benefits. This post shows how just a little bit of setup and a few derived fields results can provide valuable information about your delivery pipeline. Log management tools like Loggly can help you track these metrics and help you detect build errors, reduce build times, and accelerate your time to production.
The Loggly and SolarWinds trademarks, service marks, and logos are the exclusive property of SolarWinds Worldwide, LLC or its affiliates. All other trademarks are the property of their respective companies.
The Loggly and SolarWinds trademarks, service marks, and logos are the exclusive property of SolarWinds Worldwide, LLC or its affiliates. All other trademarks are the property of their respective owners.

Andre Newman