Intro to Jenkins X CI/CD for Kubernetes
Jenkins X (JX) is an exciting new Continuous Integration and Continuous Deployment (CI/CD) tool for Kubernetes users. It hides the complexities of operating Kubernetes by giving developers a simpler experience to build and deploy their code. You can think of it as creating a serverless-like environment in Kubernetes. As a developer, you don’t need to worry about all the details of setting up environments, creating a CI/CD pipeline, or connecting GitHub to your CI pipeline. All of this and much more is handled by JX. In this article, we’ll introduce you to JX, show you how to use it, and how to monitor your builds and production deployments.
What is Jenkins X?
JX was created by James Strachan (creator of Groovy, Apache Camel, and now JX) and was first announced in March 2018. It’s designed from the ground up to be a cloud-native, Kubernetes-only application that not only supports CI/CD, but also makes working with Kubernetes as simple as possible. With one command you can create a Kubernetes cluster, install all the tools you’ll need to manage your application, create build and deployment pipelines, and deploy your application to various environments.
Jenkins is described as an “extensible automation server” that can be configured, via plugins, to be a Continuous Integration Server, a Continuous Deployment hub, or a tool to automate just about any software task. JX provides a specific configuration of Jenkins, meaning you don’t need to know which plugins are required to stand up a CI/CD pipeline. It also deploys numerous applications to Kubernetes to support building your docker container, storing the container in a docker registry, and deploying it to Kubernetes.
Jenkins pipeline builds are driven by adding a Jenkinsfile to your project. JX automates this for you. JX can create new projects (and the required Jenkinsfile) for you or import your existing project and create a Jenkinsfile if you don’t already have one. In short, you don’t need to know anything about Jenkins or Kubernetes to get started with JX. JX will do it all for you.
Overview of How JX Works
JX is designed to take all of the guesswork or trial and error approach many teams have used to create a fully functional CI/CD pipeline in Kubernetes. To make a tailored developer experience, JX had to choose which Kubernetes technologies to use. In many ways, JX is like a Linux distribution, but for Kubernetes. JX had to decide, from the plethora of tools available, which ones to use to create a smooth and seamless developer experience in Kubernetes.
To make the transition to Kubernetes simpler, the command line tool jx can drive most of your interactions with Kubernetes. This means you don’t need to know how to use kubectl right away; instead you can slowly adopt kubectl as you become more comfortable in Kubernetes. If you are an experienced Kubernetes user, you’ll use jx for interacting with JX (CI/CD, build logs, and so on) and continue to use kubectl for other tasks.
When you create or import a project using the jx command line tool, JX will detect your project type and create the appropriate Jenkinsfile for you (if it doesn’t already exist), define the required Kubernetes resources for your project (like Helm charts), add your project to GitHub and create the necessary webhooks for your application, build your application in Jenkins, and if all tests pass, deploy your application to a staging environment. You now have a fully integrated Kubernetes application with a CI/CD pipeline ready to go.
Your interaction with JX is driven by a few jx commands to set up and env, create or import an application, and monitor the state of your build pipelines. The developer workflow is covered in the next section. Generally speaking, once set up, you don’t need to interact with JX that much; it works quietly in the background, providing you CI and CD functionality.
Install Jenkins X
To get started using JX, install the jx binary. For Mac OS, you can use brew:
brew tap jenkins-x/jx
brew install jxNote: When I first tried to create a cluster using JX, it installed kops for me. However, the first time jx tried to use kops, it failed because kops wasn’t on my path. To address this, install kops as well:
brew install kopsCreate a Kubernetes Cluster
JX supports most major cloud environments: Google GKE, Azure AKS, Amazon EKS, minikube, and many others. JX has a great video on installing JX on GKE. Here, I’m going to show you how to install JX in Amazon without EKS. Creating a Kubernetes cluster from scratch is very easy:
jx create cluster awsSince I wasn’t using JX for a production application, I ran into a few gotchas during my install:
- When prompted with, “No existing ingress controller found in the kube-system namespace, shall we install one?” say yes.
- Assuming you are only trying out JX, when prompted with, “Would you like to register a wildcard DNS ALIAS to point at this ELB address?” say no.
- When prompted with, “Would you like wait and resolve this address to an IP address and use it for the domain?” say yes.
- When prompted with, “If you don’t have a wildcard DNS setup then set up a new CNAME and point it at: XX.XX.XX.XX.nip.io. Then, use the DNS domain in the next input” accept the default.
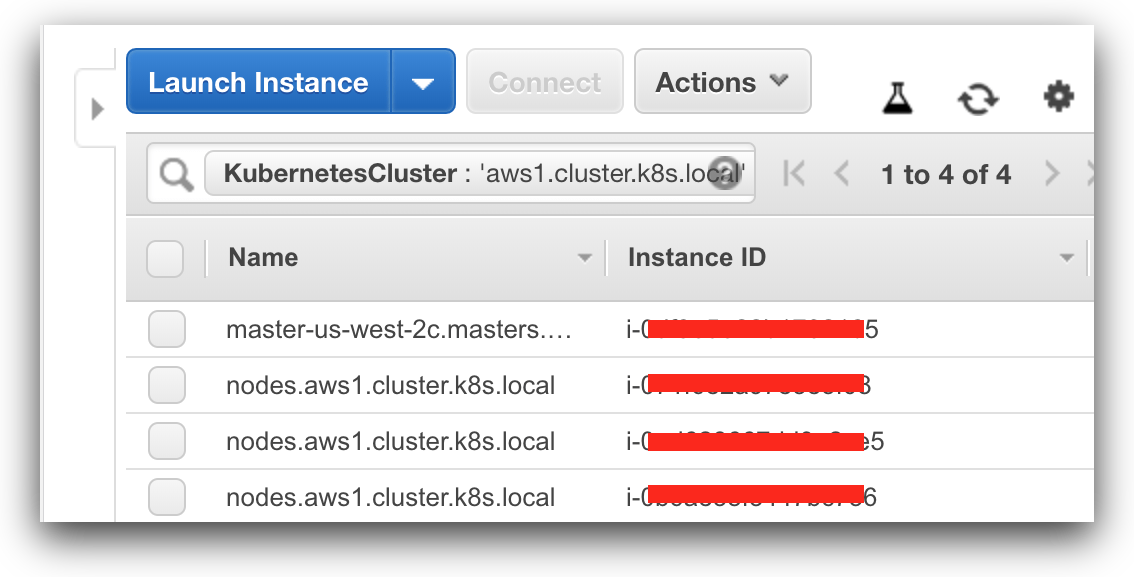
The image below shows you the EC2 instances that JX created for your Kubernetes Cluster (master is an m3.medium instance and the nodes are t2.medium instances):
When you are ready to remove the cluster you just created, you can use this command (JX currently does not provide a delete cluster command):
kops delete clusterHere’s the full kops command to remove the cluster you just created (you’ll want to use the cluster name and S3 bucket for all kops commands):
kops delete cluster --name aws1.cluster.k8s.local \
--state=s3://kops-state-xxxxxx-ff41cdfa-ede6-11e8-xx6-acde480xxxx
To add Loggly integration to your Kubernetes cluster, you can follow the steps outlined here.
Create an Application
Now that JX up and running, you are ready to create an application. The quickest way to do this is with the JX quickstart. In addition to the quickstart applications that come with JX, you can also create your own.
To get started, run create quickstart, and pick the spring-boot-http-gradle quick start (see the screenshot below for more details):
jx create quickstart
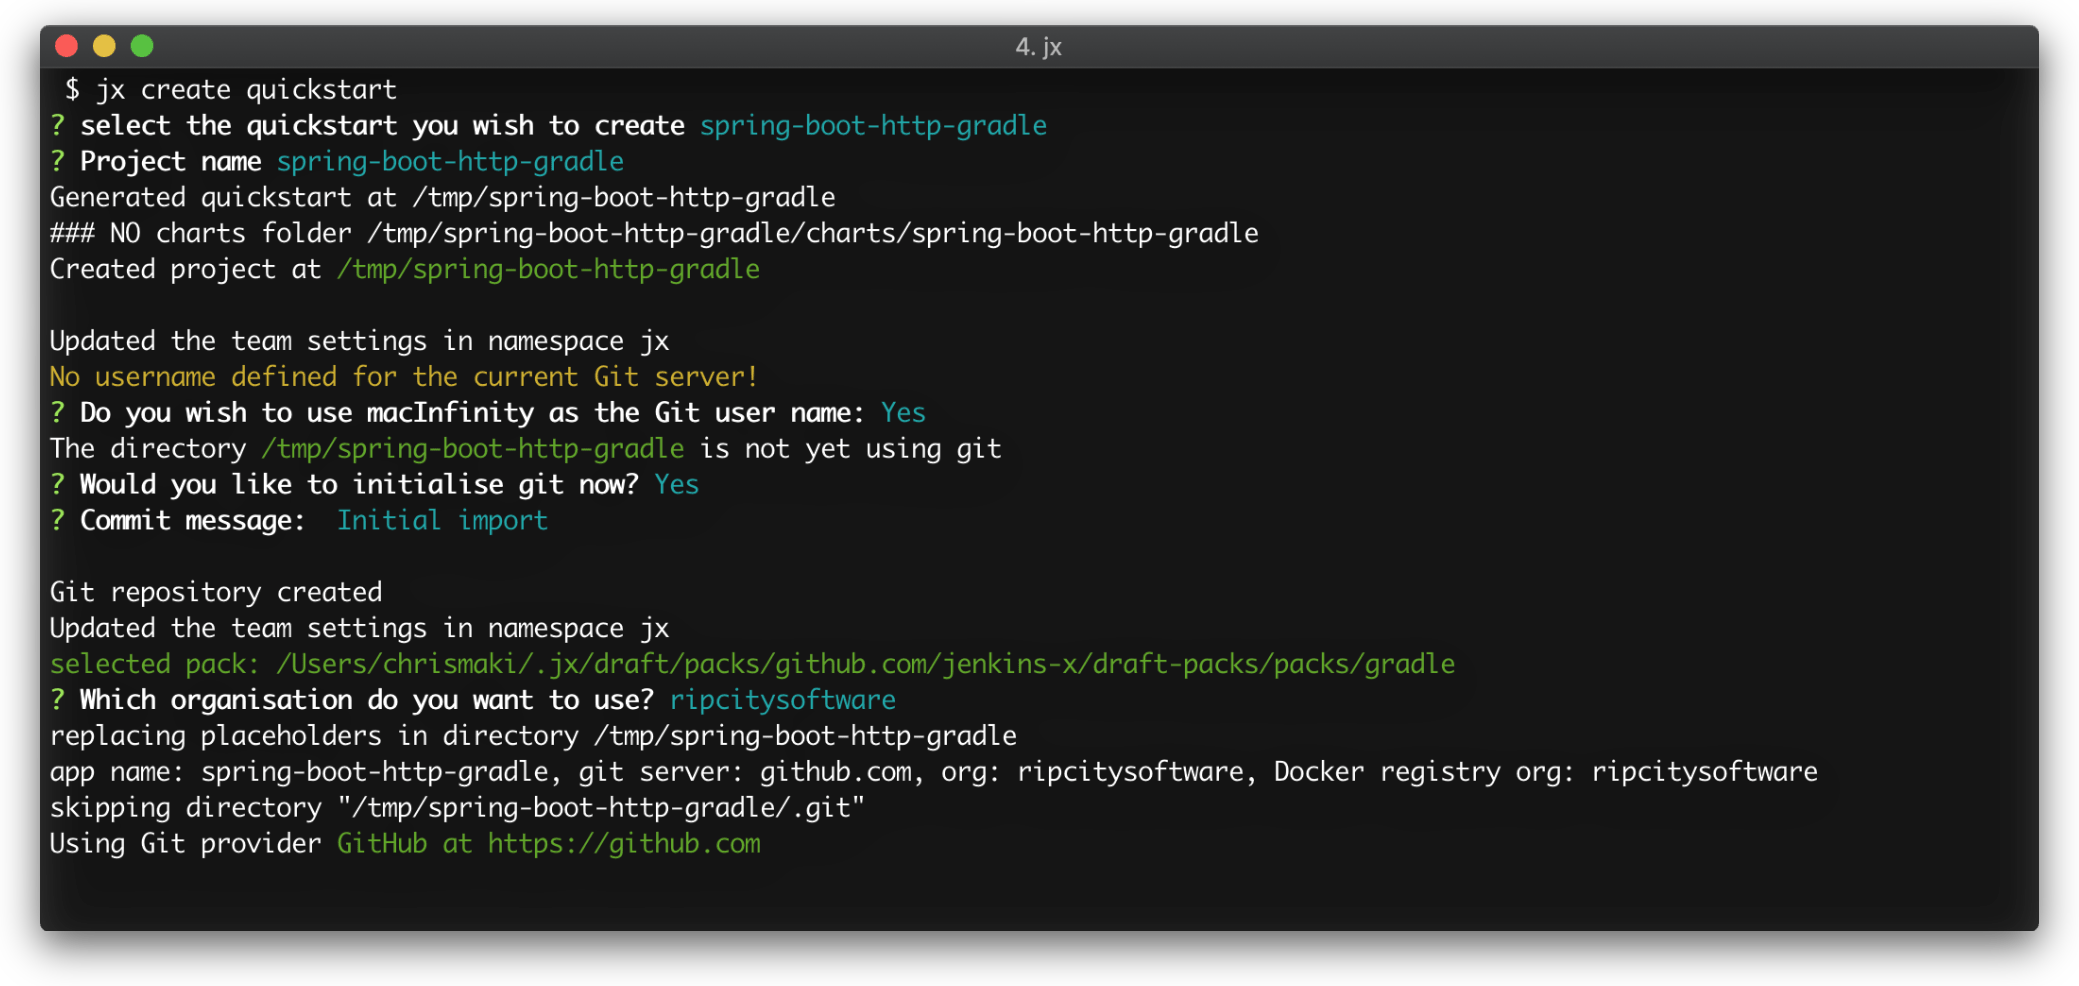
Note: During the install process, I did run into one issue. When prompted with, “Which organization do you want to use?” make sure you choose a GitHub Org and not your personal account. The first time I ran this, I tried my personal account (which has an org associated with it) and jx create quickstart failed. When I reran it, I chose my org ripcitysoftware and everything worked as expected.
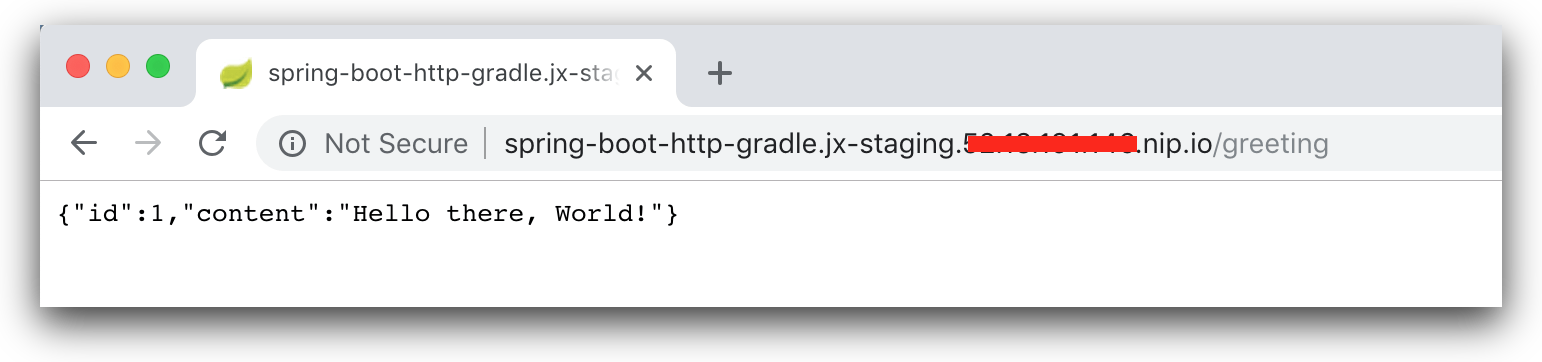
Once your application has been created, it will automatically be deployed to the staging environment for you. One thing I really like about JX is how explicit everything is. There isn’t any confusion between temporary and permanent environments because the environment name is embedded into the application URL (https://spring-boot-http-gradle.jx-staging.xx.xx.xx.xx.nip.io/).
The Spring Boot quickstart application provides you with one rest endpoint:
Developer Workflow
JX has been designed to support a trunk-based development model promoted by DevOps leaders like Jez Humble and Gene Kim. JX is heavily influenced by the book Accelerate (you can find more here), and as such it provides an opinionated developer workflow approach. Trunk-based development means releases are built off of trunk (master in git). Research has shown that teams using trunk-based development are more productive than those using long-lived feature branches. Instead of long-lived feature branches, teams create branches that live only a few hours, making a few small changes.
Here’s a short overview of trunk-based development as supported by JX. To implement a code change or fix a bug, you create a branch in your project, write tests, and make code changes as needed. (These changes should only take a couple of hours to implement, which means your code change is small.) Push your branch to GitHub and open a Pull Request. Now JX will take over. The webhook installed by JX when it imported your project will trigger a CI build in Jenkins. If the CI build succeeds, Jenkins will notify GitHub the build was successful, and you can now merge your PR into master. Once the PR is merged, Jenkins will create a released version of your application (released from the trunk branch) and deploy it (CD) to your staging environment. When you are ready to promote your application from stage to production, you’ll use the jx promote command.
The development workflow is expected to be:
- In git, create a branch to work in. After you’ve made your code changes, commit them and then push your branch to your remote git repository.
- Open a Pull Request in your remote git repo. This will trigger a build in Jenkins. If the build is successful, JX will create a preview environment for your PR so you can review and test your changes. To trigger the promotion of your code from Development to Staging, merge your PR.
- By default, JX will automatically promote your code to Stage. To promote your code to Production, you’ll need to run this command manually:
jx promote app-name --version x.y.z --env production
Monitoring Jenkins X
Monitoring the status of your builds gives you insight into how development is progressing. It will also help you keep track of how often you are deploying apps to various environments.
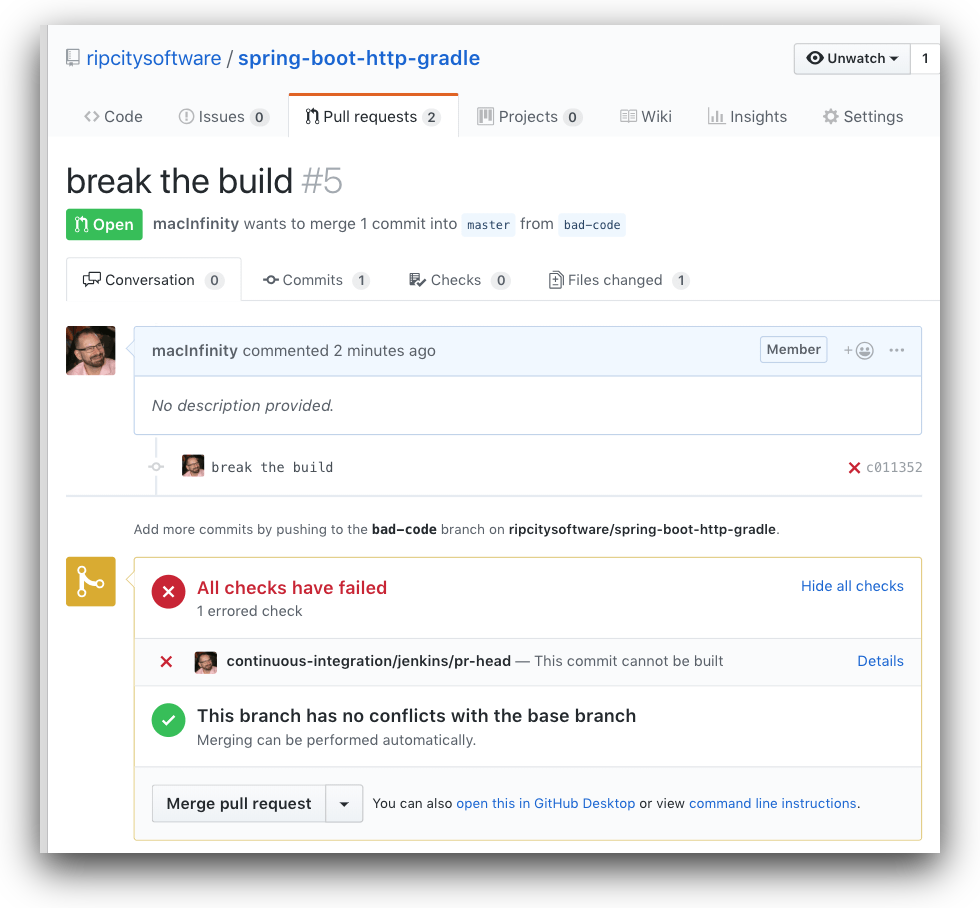
JX provides you multiple ways to track the status of a build. JX configures Jenkins to trigger a build when a PR is opened or updated. The first place to look for the status of your build is in GitHub itself. Here is a build in GitHub that resulted in a failure. You can clearly see the CI step has failed:
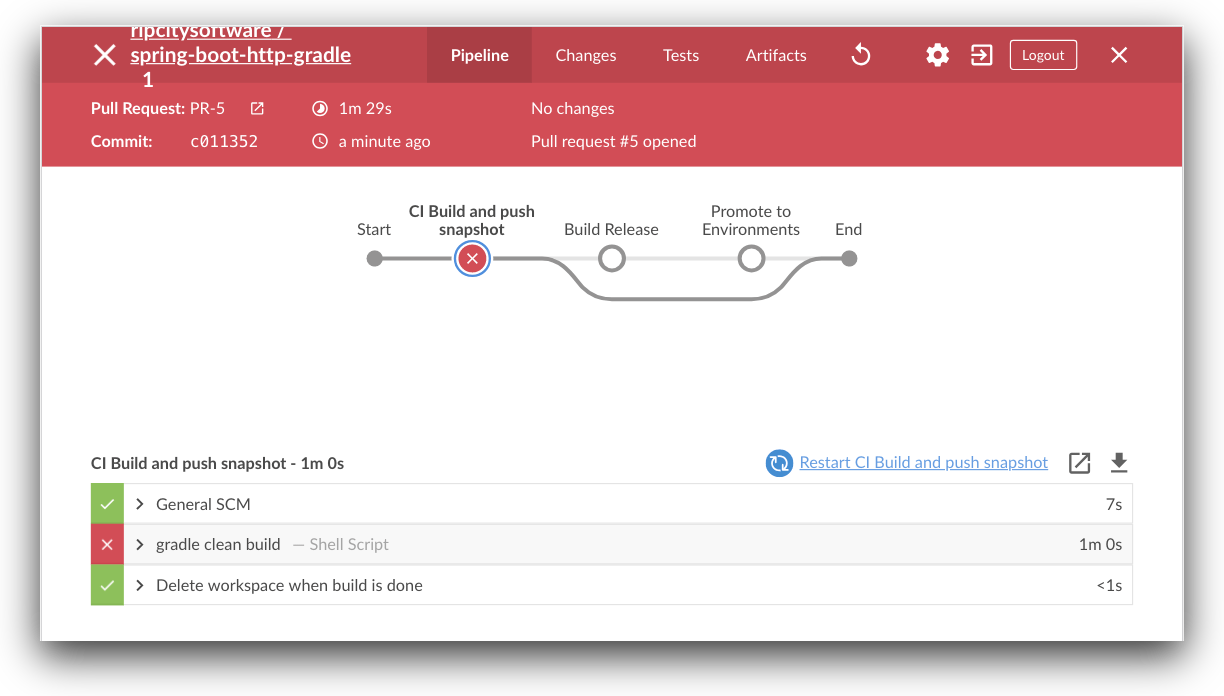
The next way to check on the status of your build is in Jenkins itself. You can navigate to Jenkins in your browser or, from GitHub, you can click the “Details” link to the right of “This commit cannot be built.” Here is the Jenkins UI. You will notice Jenkins isn’t very subtle when a build fails:
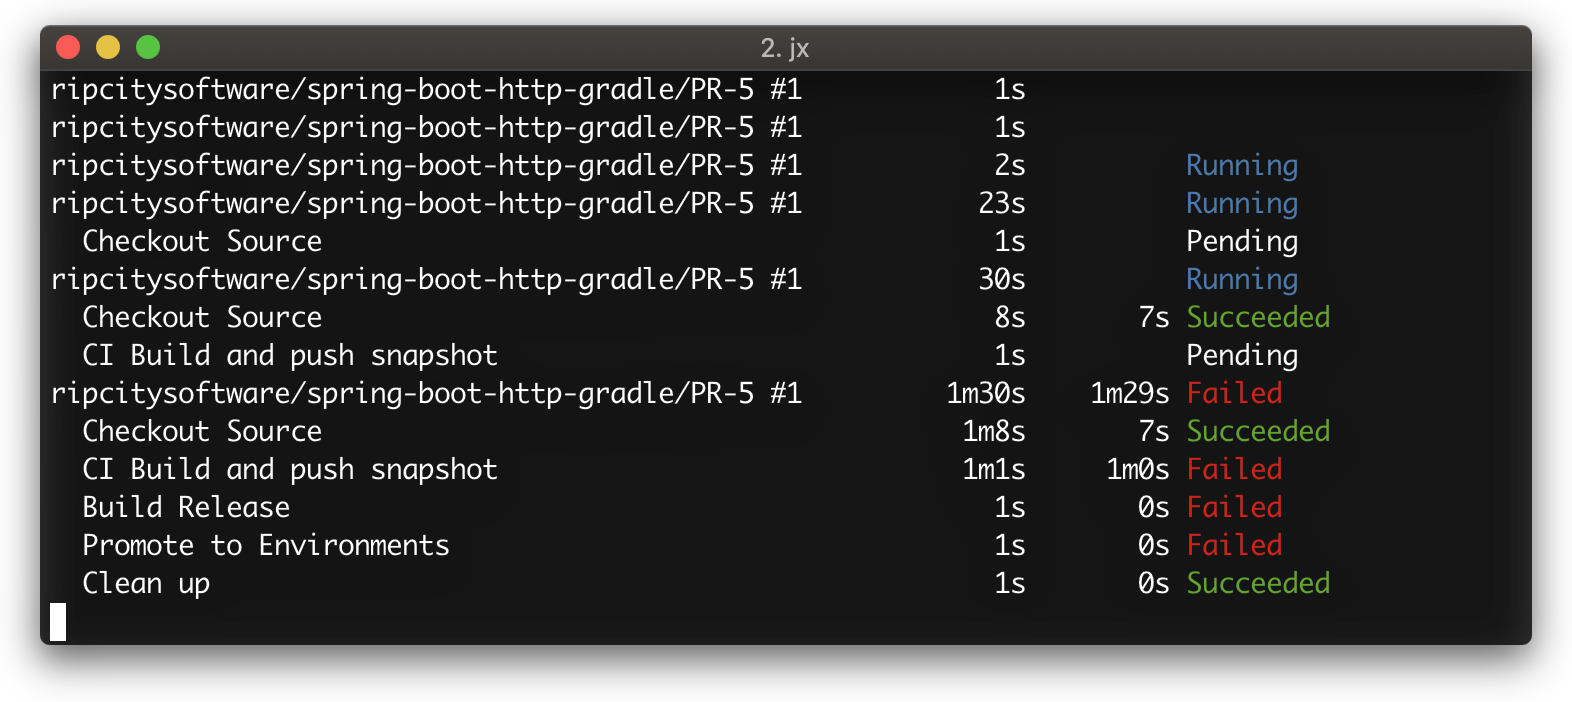
A third way to track the status of your build is from the command line, using the jx get activity command:
If you want to see the low-level details of what Jenkins is logging, you’ll need to look at the container Jenkins is running in. Jenkins is running in Kubernetes like any other application. It’s deployed as a pod and can be found using the kubectl command:
$ kubectl get pods
NAME                      READY     STATUS    RESTARTS   AGE
jenkins-fc467c5f9-dlg2p   1/1       Running   0          2d
Now that you have the name of the Pod, you can access the log directly using this command:
$ kubectl logs -f jenkins-fc467c5f9-dlg2p
Finally, if you’d like to get the build output log, the log that’s shown in the Jenkins UI, you can use the command below. This is the raw build log that Jenkins creates when it’s building your application. When you have a failed build, you can use this output to determine why the build failed. You’ll find your test failures here along with other errors like failures in pushing your artifacts to a registry. The output below is not logged to the container (and therefore not accessible by Loggly):
$ jx get build log ripcitysoftware/spring-boot-http-gradle/master
view the log at: https://jenkins.jx.xx.xx.xxx.xxx.nip.io/job/ripcitysoftware/job/spring-boot-http-gradle/job/master/2/console
tailing the log of ripcitysoftware/spring-boot-http-gradle/master #2
Push event to branch master
Connecting to https://api.github.com using macInfinity/****** (API Token for accessing https://github.com Git service inside pipelines)
Monitoring in Loggly
One of the principles of a microservice architecture, as described by Sam Newman in Building Microservices, is being Highly Observable. Specifically, Sam suggests that you aggregate all your logs. A great tool for this is SolarWinds® Loggly™. Loggly is designed to aggregate all of your logs into one central location. By centralizing your logs, you get a holistic view of your systems. Deployments can trigger a change in the application that can generate errors or lead to instability. When you’re troubleshooting a production issue, one of the first things you want to know is whether something changed. Being able to track the deployments in your logs will let you backtrack deployments that may have caused bugs.
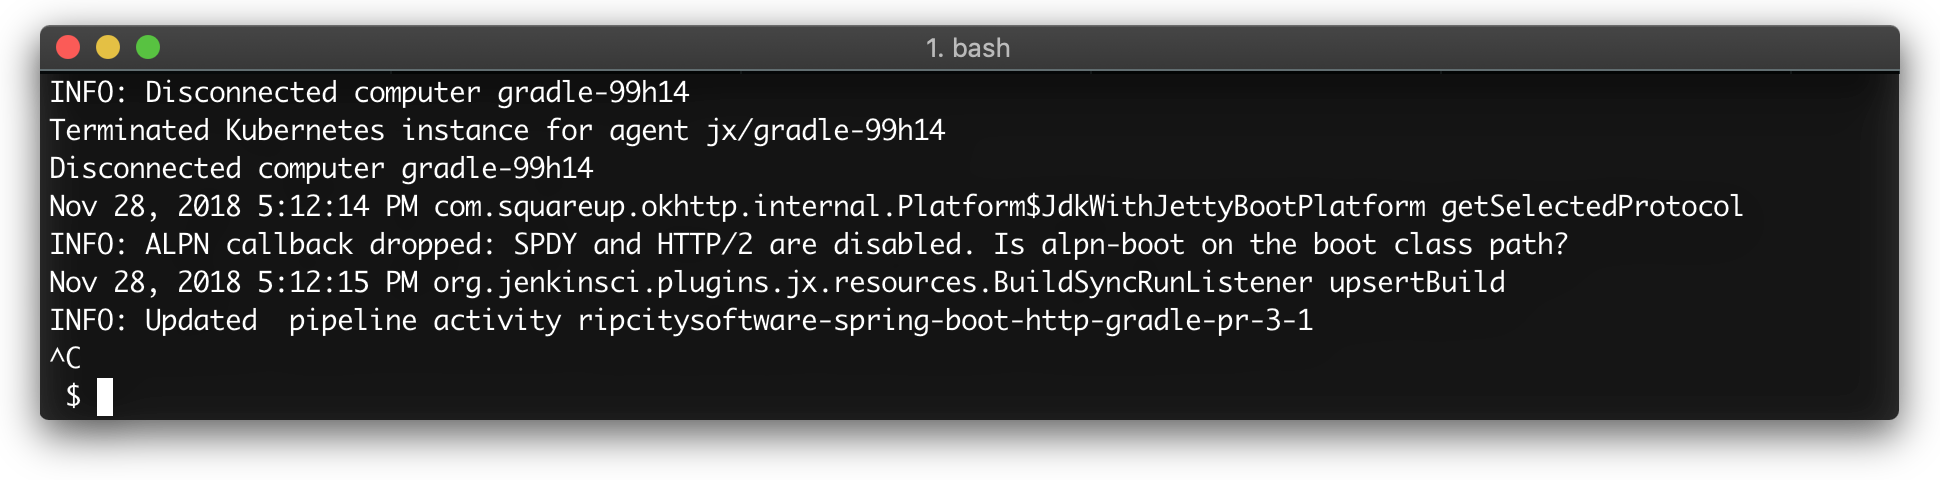
To monitor deployments, we need to know what’s logged when a deployment succeeds or fails. This is the message Jenkins logs when a build has completed:
INFO: ripcitysoftware/spring-boot-http-gradle/master #6 completed: SUCCESSFrom the above message, we get a few pieces of information: the name of the branch, which contains the Project name ripcitysoftware/spring-boot-http-gradle and the branch master, the build number #6, and finally the build status SUCCESS.
The metrics you should monitor are:
- Build status – Whether a build was a success or failure
- The project name – Which project is being built
- The build number – Tracks PRs and releases
By tracking the build status, you can see how often builds are succeeding or failing. The project name and build number tell you how many PRs have been opened (look for “PR” in the project name) and how often a release is created (look for “master” in the name).
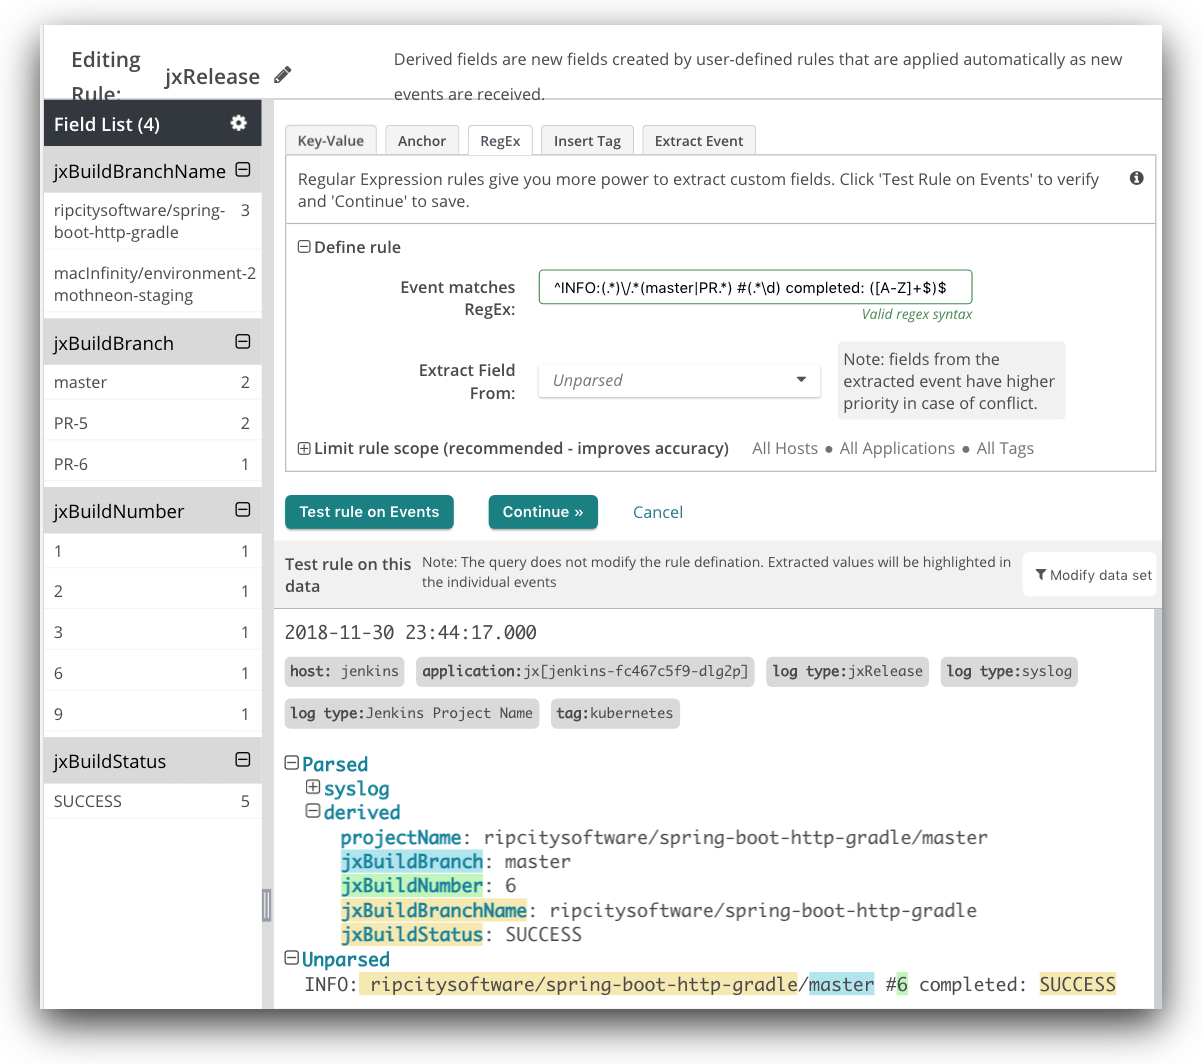
To track all of the above fields, create one Derived Field in Loggly called jxRelease. Each capture group (the text inside of the parentheses) defines a unique Derived Field in Loggly. Here is the regex you’ll need:
^INFO:(.*)\/.*(master|PR.*) #(.*\d) completed: ([A-Z]+$)$
Here’s the Jenkins build success log-message above as it appears in Loggly after we’ve created the Derived Field. You can see all the fields we are defining highlighted in yellow below the Rule editor:
Please note that Derived Fields use past logs only in the designer tool. Loggly only adds new derived fields to new log messages. This means if you’ve got an hour of Jenkins output already sent to Loggly and you create the jxBuildXXX fields (as shown above), only new log messages will include this field.
In the image below, you can see all the Derived Fields that have been parsed in the last 30 minutes. For jxBuildBranchName, there has been one build to stage, and it was successful, as indicated by the value SUCCESS. We also see that nine (9) builds have been pushed to stage, as indicated by the jxBuildNumber field.
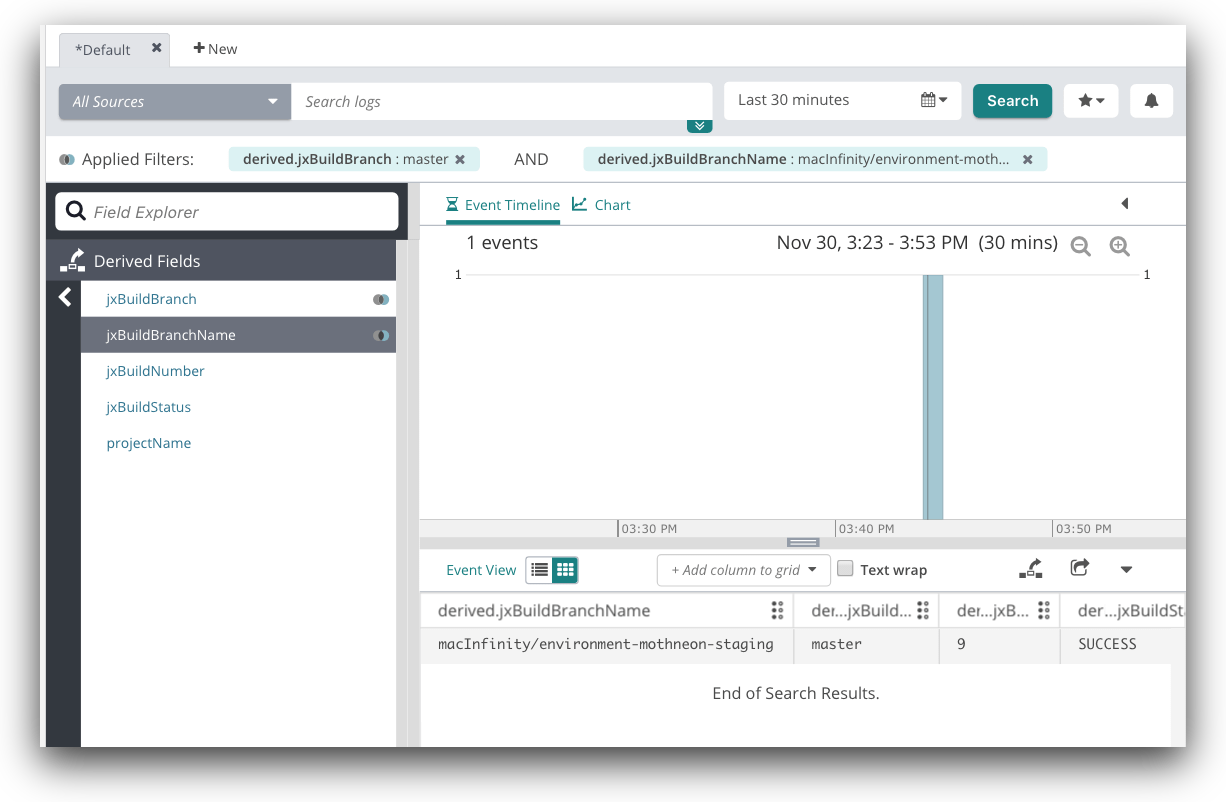
Now that these fields are parsed out of the logs, we can filter on them using the Field Explorer. Above, you can see that we have filtered on the master branch. This shows us each time the master branch has changed. When we are troubleshooting a production bug, we can now see the exact time the code changed. If the bug started after a deployment, then the root cause could be the code change. This helps us narrow down the root cause of the problem faster.
We can also track when master branch builds fail and fire an alert to notify our team on Slack or email. Theoretically, this should never happen, assuming we are properly testing the code. However, there could have been an integration problem that we missed, or a failure in the infrastructure. Setting an alert will notify us of these problems so we can fix them quickly.
Conclusion
JX is an exciting addition to Jenkins and Kubernetes alike. JX fills a gap that has existed since the rise of Kubernetes: how to assemble the correct tools within Kubernetes to get a smooth and automated CI/CD experience. In addition, JX helps break down the barrier of entry into Kubernetes and Jenkins for CI/CD. JX itself gives you multiple tools and commands to navigate system logs and track build pipelines. Adding Loggly integration with your JX environment is very straightforward. You can easily track the status of your builds and monitor your apps progression from development to a preview environment, to a staging environment and finally to production. When there is a critical production issue that you are troubleshooting, you can look at the deployment time to see if changes in the code caused the issue.
The Loggly and SolarWinds trademarks, service marks, and logos are the exclusive property of SolarWinds Worldwide, LLC or its affiliates. All other trademarks are the property of their respective owners.

Chris Maki