Announcing the Loggly New Relic Extension and Integration: More Simplicity for #DevOps Troubleshooting
As #DevOps, you are responsible for ensuring that both Development and Operations are humming at your organization.
You already have a set of tools to help you with your mission. It is likely that you have an application performance management (APM) solution to give you a health state, or the “how” state of your applications. In fact, we hear our customers mention New Relic more than any other APM vendor.
You probably also have a log management solution in place to expose log data. If you don’t, you should! Because you know that when you need to know “why” something is happening, the truth is in your logs.
With Loggly’s extension to New Relic, you now have a seamless transition from “how” to “why” and a fast path to the root cause of any problem.
Here are some of the use cases that the Loggly New Relic extension and new integration solves, making your life much easier:
Trace Performance Bottlenecks Across Multiple Applications
Imagine that New Relic tells you about one of your apps whose response time is way beyond its SLA. How do you identify the bottleneck? For one, performance issues are global in that they can happen with the application, with a back-end server, a DBMS, or the network. Visibility in the application alone is often not enough to find the problem. Event logs are great data points for the identification of such issues. Logs are universal in nature, can be generated by any type of IT device, and are easily collected by Loggly without having to deploy any agents.
Customers kept asking for a way to single-click from the New Relic view into the same view in Loggly, capturing the same event as seen through logs. With a holistic view of not only the application log events but also all of the logs from the relevant devices, you can trace the requests or the transactions across multiple applications, or from client side to server side. You now have all the context required to easily pinpoint the performance bottleneck.
Error Troubleshooting and Root Cause Analysis
Suppose that New Relic tells you about some errors that your application is experiencing. So you get the proper dashboard in New Relic and focus the view on the general area of the problem. What next?
Customers told us repeatedly that being able to switch into a log-powered view of the exact same error would be very valuable. Now, identification of root cause is obvious. You see what happened before the error and the actions that led up to it. You can follow the logical paths that the program took to get there, and you can analyze the behavior and end-to-end application model. You can now quickly understand if it’s an application error, an error propagating from one of the dependencies of the application, or an error that is due to the infrastructure powering the application.
Other Use Cases
Loggly also allows you to:
-
Look at warnings or more verbose log levels
-
Check log messages inserted by developers around common problems
-
Trace code path execution to verify your logic and input parameters
-
Trace requests or transactions across multiple applications and servers
-
Validate parameters and data to third party services and APIs
-
Load entire sessions for particular customers or transactions for debugging and customer service
-
Correlate problems with external systems like routers, load balancers, and CDNs
Complete visibility with a single click.
How Do I Use It?
When you are connected to your New Relic dashboard using Chrome, you will notice a “Search Events with Loggly” button on the upper right of your dashboard.
Just click on that button and Chrome will open a new tab for Loggly. All of the New Relic parameters and context information—such as time range, servers, and application—are automatically populated into Loggly. You are now looking at the exact same situation, but a complete, log-powered Loggly view that helps you understand why this is happening.
Let’s look at how you would address a sudden spike in your application’s error rate as indicated by New Relic.
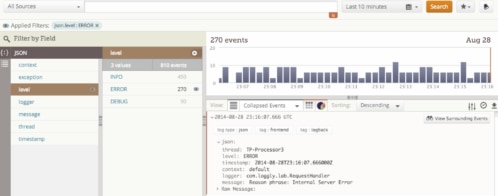
When you click on “Search Events in Loggly” in the upper right corner, you instantly switch your view to the same event in Loggly. Here we have selected to graph the count of errors, which has the same shape as the New Relic graph. All times are converted to UTC.
A click later, the exact same error message you had in New Relic is identified in Loggly.
You can step backward through the code path to see what caused the problem and find the root cause. By searching on the session ID, you can see what led up to the error, the query that was executed when the timeout happened, json.querytime_ms. So instead of just seeing a stack trace, you can see the values of the parameters just like a debugger.
How Do I Get It?
Don’t have Loggly yet? Sign up for our free trial, and you’ll see what Loggly can do for you, your application logs, and any other logs that you may have: Actionable insights with no agents, no downloads, and no sweat.
That’s it. Nothing more to do. Enjoy seamless switching between New Relic, and let your sanity benefit from the complementary “how” and “why” views.
The Loggly and SolarWinds trademarks, service marks, and logos are the exclusive property of SolarWinds Worldwide, LLC or its affiliates. All other trademarks are the property of their respective owners.
Hector Angulo


