Error Reporting: How to Use Loggly to Report on Errors and Exceptions
At Loggly, we regularly ask our trial users about how they are using our log management service. Reporting on errors and exceptions, cited by more than 40% of customers, is the #2 use case for Loggly users. In this post, I’ll explain how to find and rank your top errors and share them on a dashboard for your whole team to see.
Why Use Loggly for Error Reporting?
Using Loggly to report on errors and exceptions offers two key benefits:
- You and your team have one place where you can see if problems have cropped up across all of your servers
- Peace of mind for your team: You can monitor for problems after deploying new code and find out about bugs or unexpected user behavior. You’ll be alerted right away, and your management team can keep track of what’s going on from a single dashboard.
Examples of Error Reporting with Loggly
You can report on the count of your most common errors and report how many are happening over time.
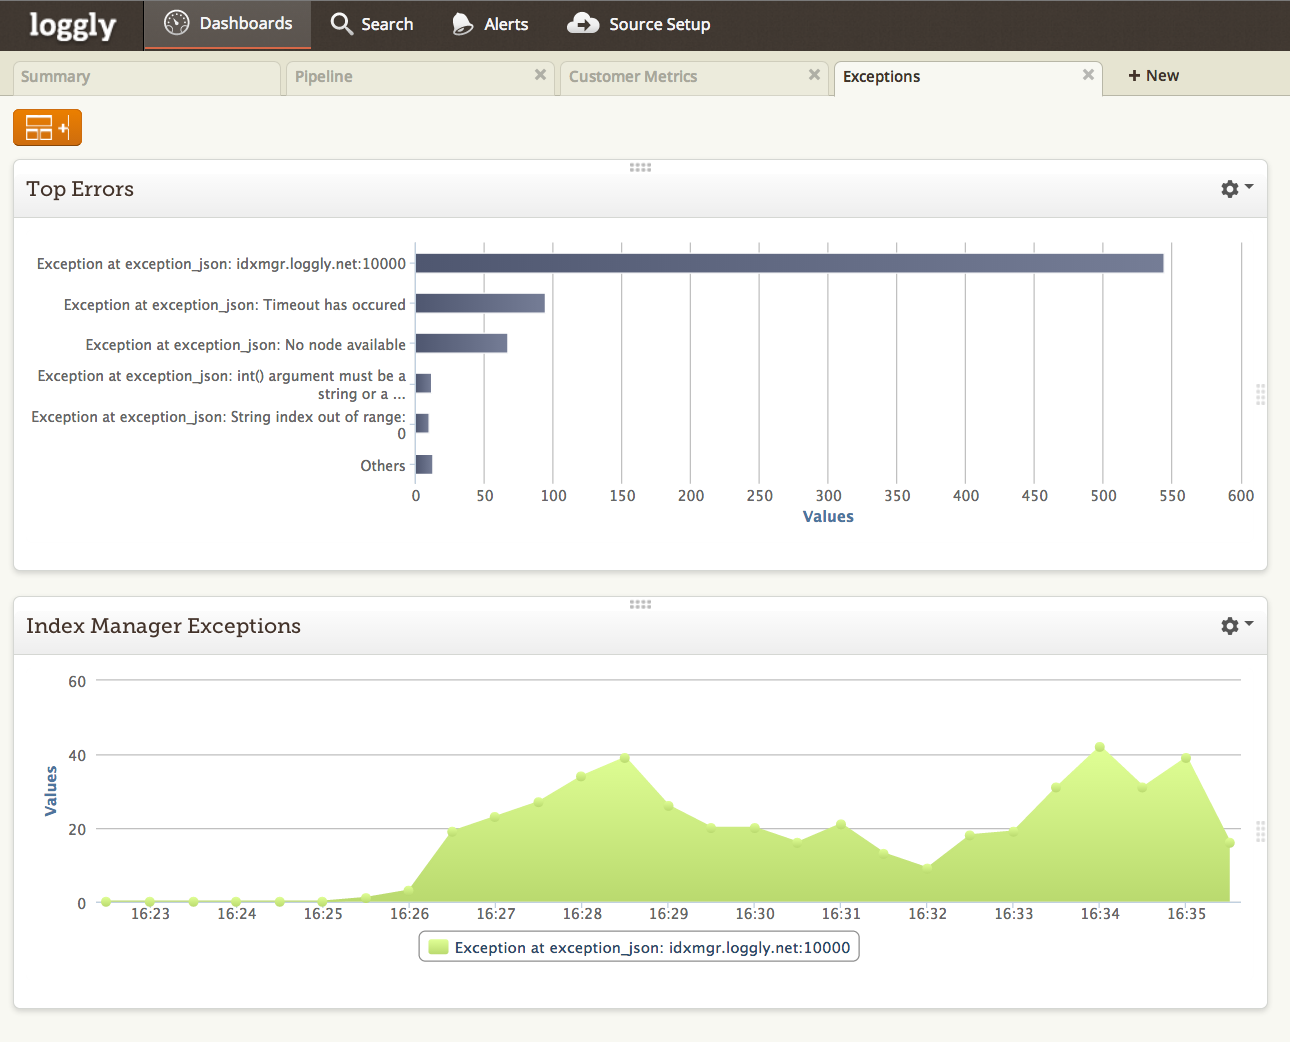
At the top of the screenshot above, you can see the top errors that are occurring in my application over the last day and a count of how often they occur. I’m also looking at how many exceptions are occurring over time for the most common error, which in this case is an Index Manager exception.
How to Set Up Error Reporting
Here’s how I went about creating the dashboards shown above.
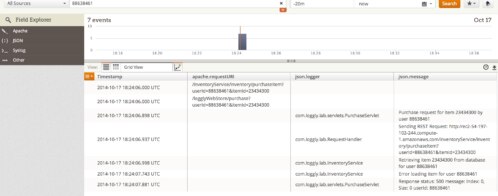
Step 1: Do a search of all logs over a set time period.
Search over a shorter period if you just pushed a release or are troubleshooting a live problem. Choose a longer time period to look at trends and report to management.
Step Two: Filter your logs to show errors only.
Search for errors in your application. To do this, you can execute a full text search such as for “ERROR” or search in an automatically parsed field. In this example, I sent JSON logs and can filter on json.level:ERROR.
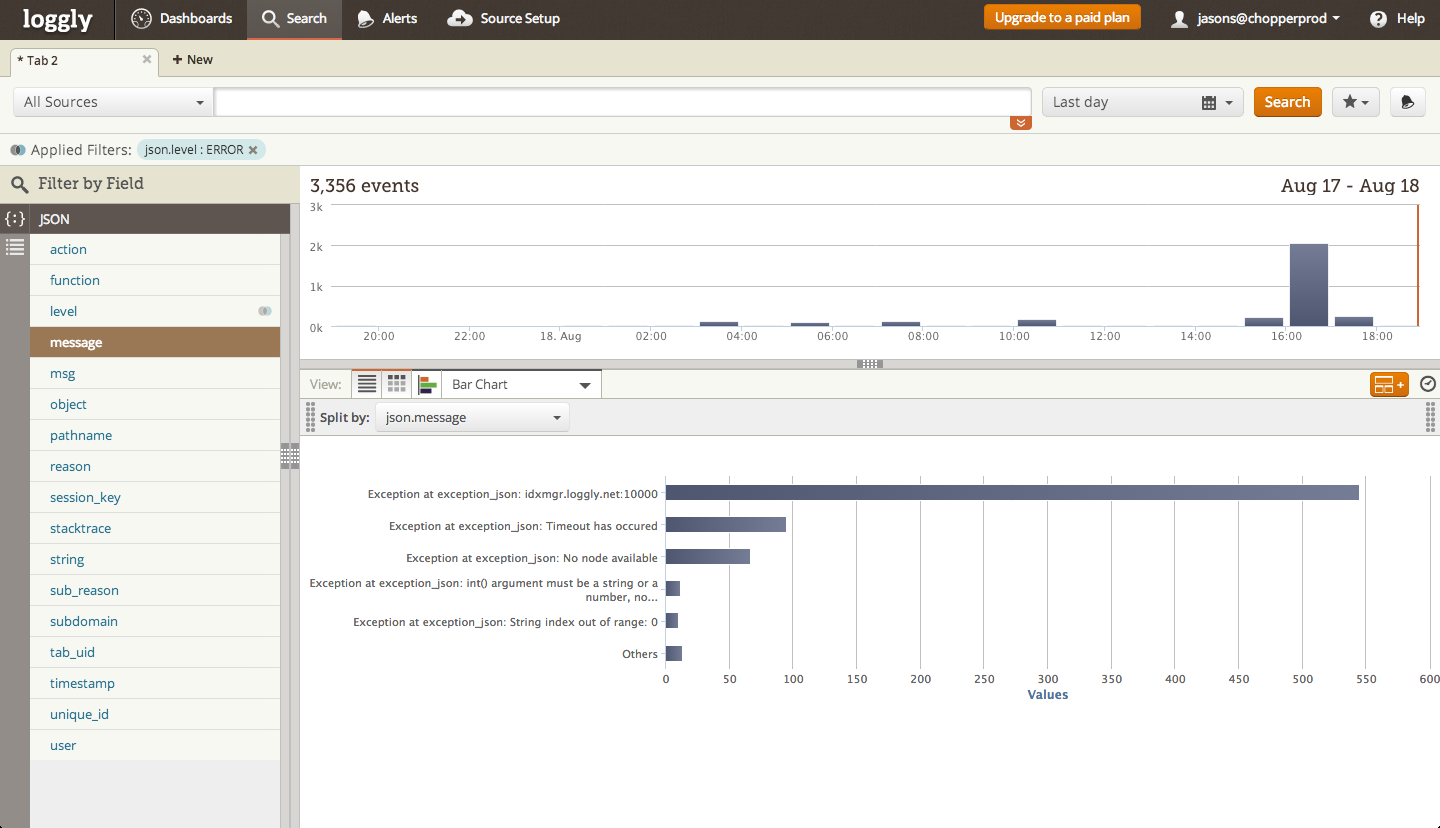
Step Three: Create a bar chart showing the top errors.
Just below the event timeline, you’ll find the trend view icon. Click it, and a pull down menu will expand, allowing you to select a chart type.
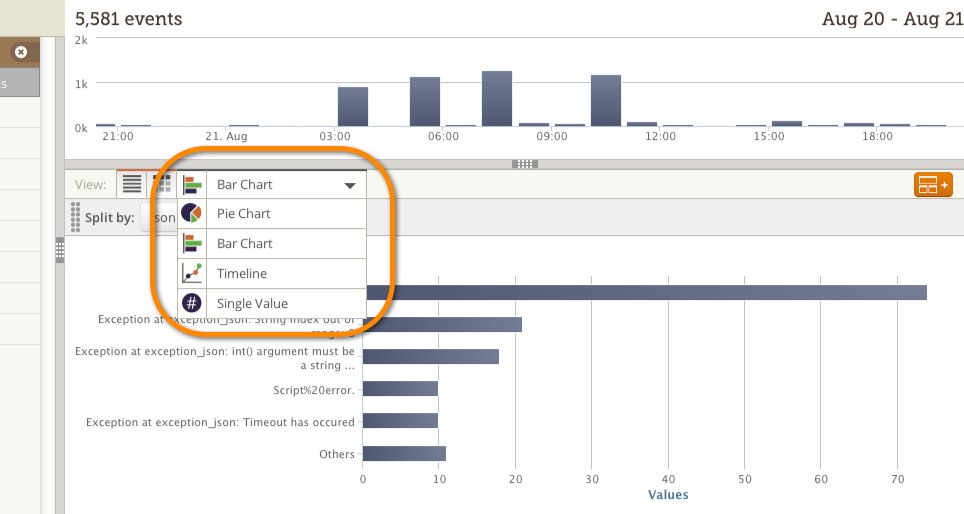
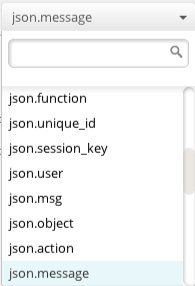
To separate your error messages, click the “Split by” drop down menu. I selected json.message so that I could get a count of each different error.
Step Four: Turn your bar chart into a dashboard widget.
To do so, just click on the orange button ![]() on the right-hand side above your chart.
on the right-hand side above your chart.
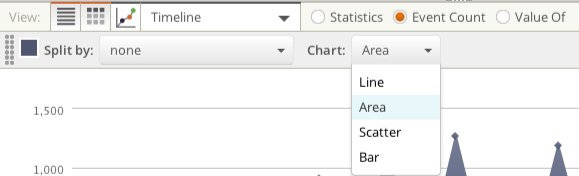
Step Five: Create timeline views for errors on key application services.
You can also show a trend of your errors over time. To create my Index Manager widget, I selected the Timeline as my chart type and then chose Event Count/ Area Chart. Note that with the timeline view you can track not only exception counts but also averages, maximums, or minimums. Don’t forget to save your final product as a widget!
Step Six: Build an operational dashboard.
Finally, you can bring all of your widgets together in a single operational dashboard. Just go to the Dashboards page in Loggly, click on New ![]() and then use the orange button to add widgets. Click on the tab to give your dashboard a descriptive name.
and then use the orange button to add widgets. Click on the tab to give your dashboard a descriptive name.
Error Reporting Makes Life Much Easier
In just a few minutes, you’re able to create a dashboard that shows your top errors and gives your developers the insight they need to prioritize their efforts on the biggest problems. You can share this insight across your team and your management at any point in time.
Learn more about:
- AngularJS exception handling
- Node.js exception handling
- Java exception handling
- Python exception handling
The Loggly and SolarWinds trademarks, service marks, and logos are the exclusive property of SolarWinds Worldwide, LLC or its affiliates. All other trademarks are the property of their respective owners.

Jason Skowronski