Monitoring Loggly with Loggly: Nagios Integration
Log collection, processing, parsing, and indexing are the core of Loggly’s log management business. The steps in this pipeline allow us to present huge piles of logs to our users in a fast, concise, simple manner so they can find solutions to their problems faster. (If you want to learn more about how our pipeline works, you can read this earlier blog post from our infrastructure engineers.) The job of my technical operations team is to make sure that data in the pipeline moves smoothly. We use a number of tools to keep tabs of the health of our systems and applications. Since Loggly’s application logs are already going to a centralized location (Loggly, of course!), it makes sense to have the system health and performance information there as well.
Aggregating application logs and performance information allows us to:
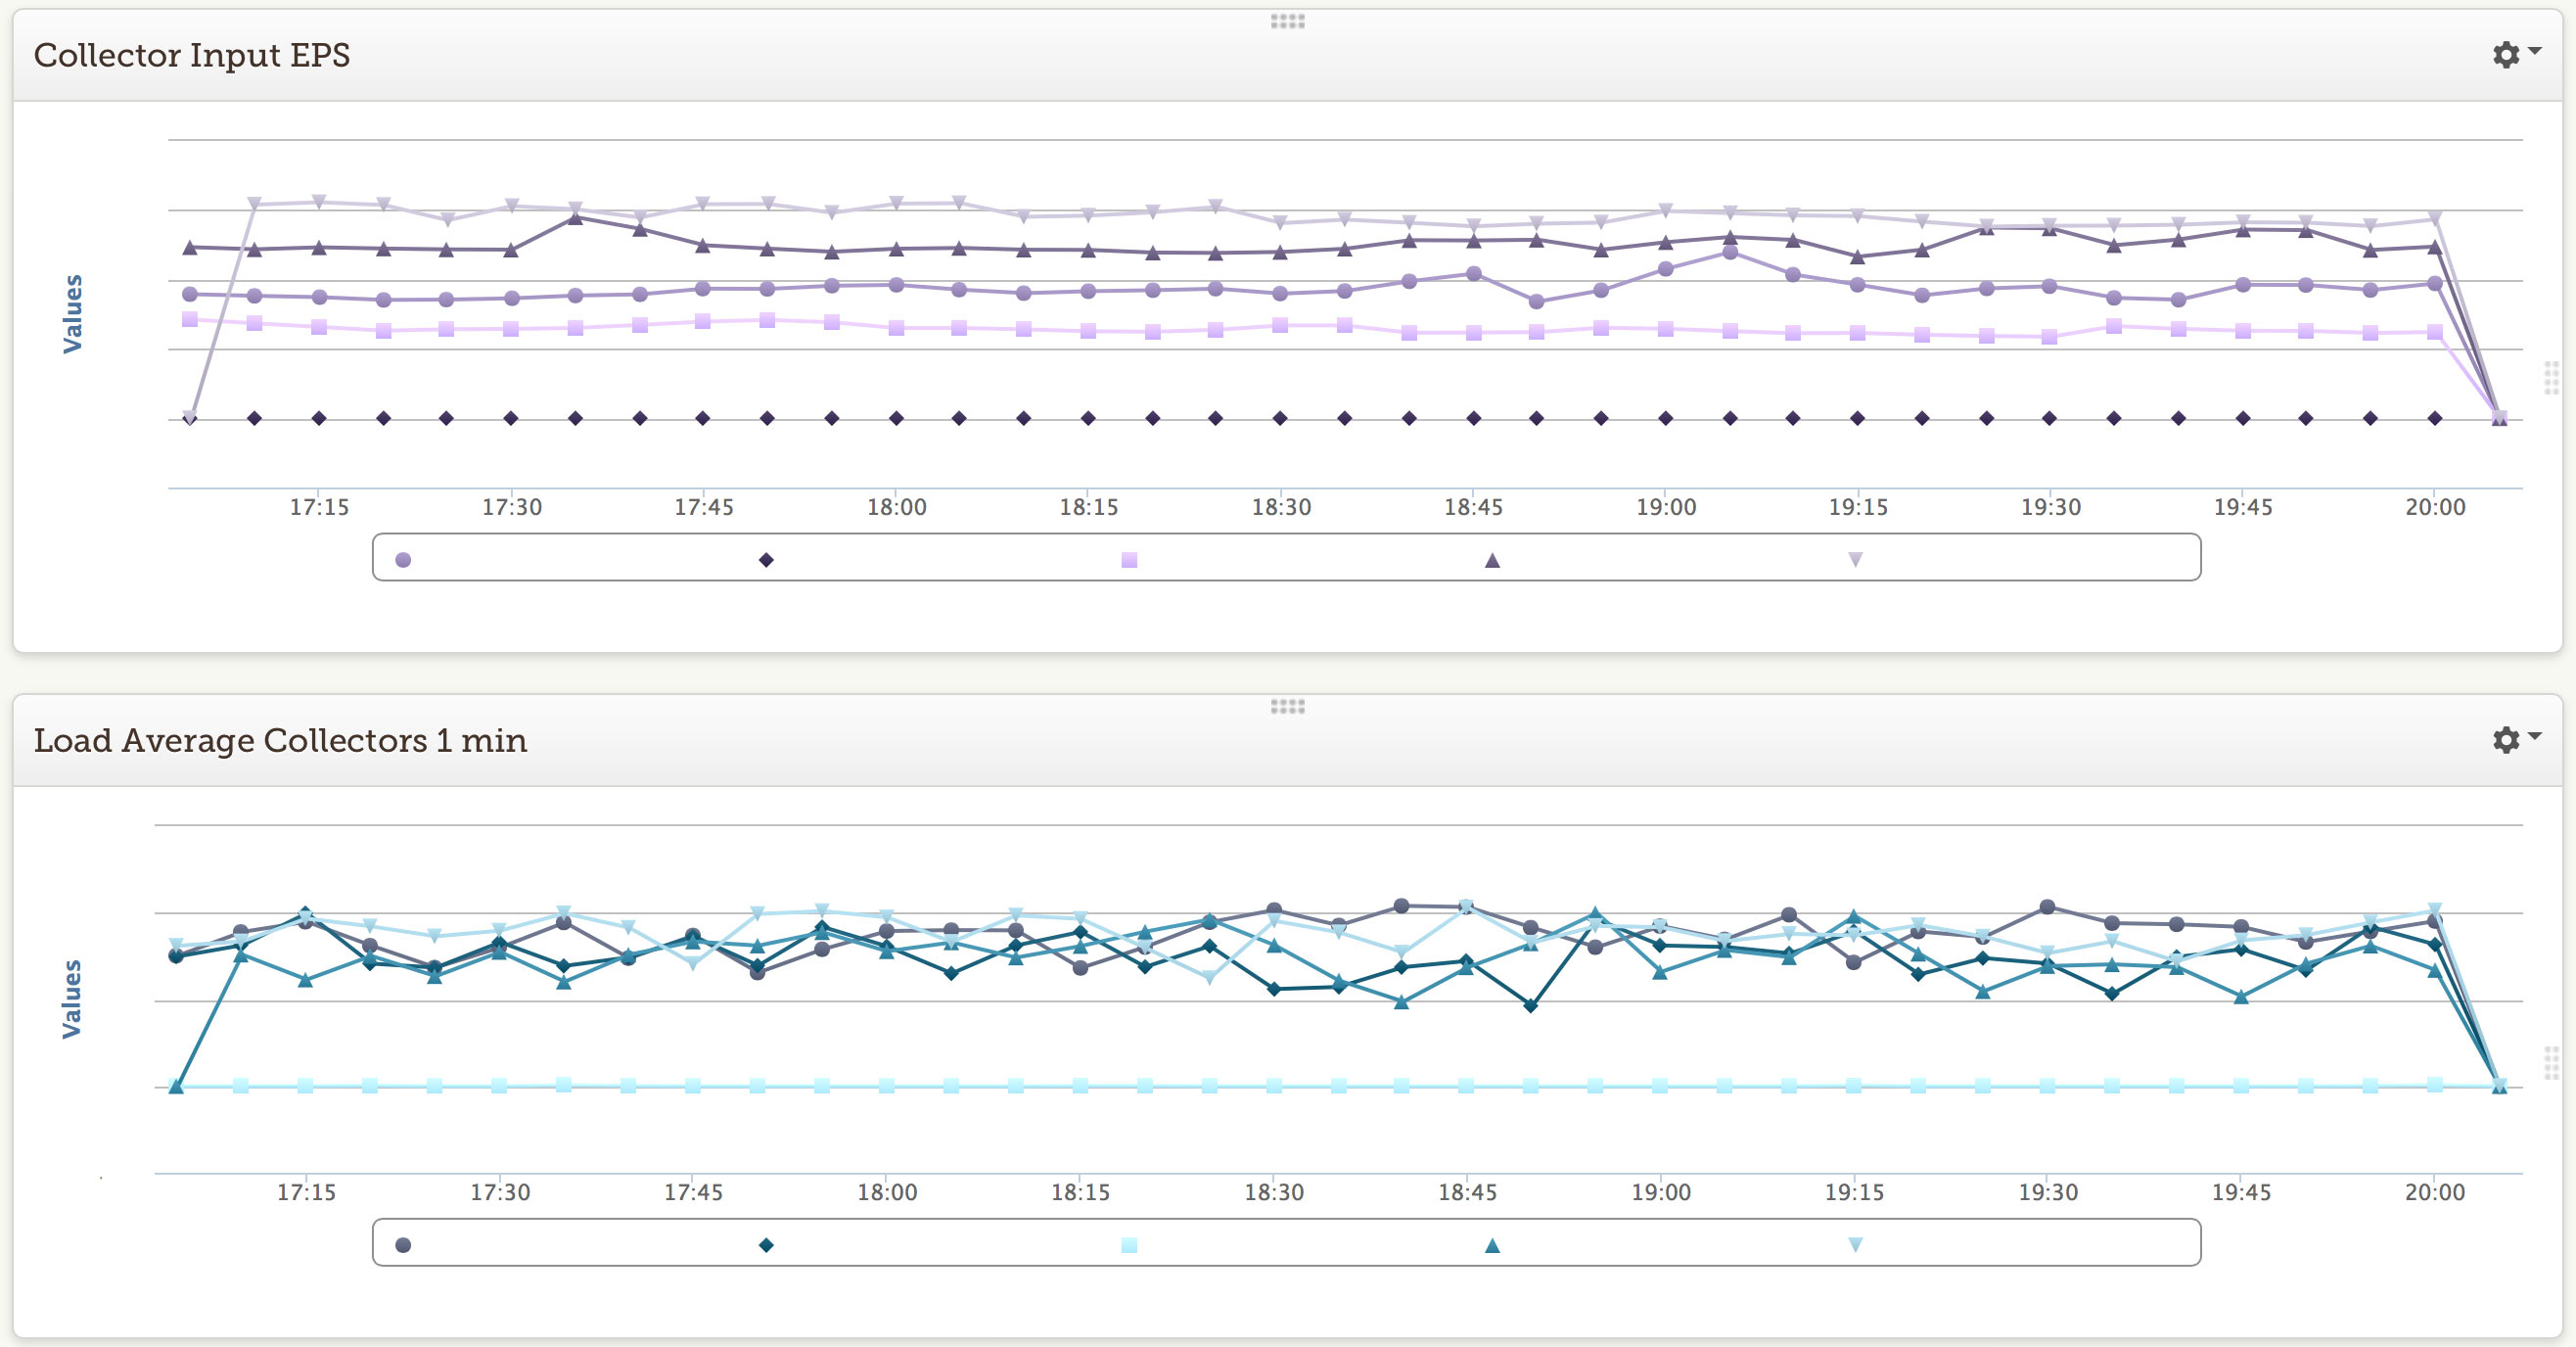
1) Correlate machine load averages to ingestion rates at our data collectors.
2) Understand the search performance of an Elasticsearch cluster.
3) Visualize Apache Kafka deltas for various consuming applications in our pipeline.
As Manoj Chaudhary mentioned in his earlier post, metrics APIs are critical to understanding the performance of an application. We capture a lot of data through these application metric APIs. Additional metrics on the state of the underlying machine, OS, and network add more detail and color to the performance of an application. Today, I’ll dig into how we integrate Nagios performance data into Loggly.
We are using Nagios Core 3.5.1 with check_mk and pnp4nagios for our basic infrastructure monitoring: disk, CPU, memory, network, process tables, etc. Like any organization with a moderately complex application stack, we also have a number of custom service checks which are run by Nagios. Using check_mk allows us to have our service checks run every minute instead of the typical five-minute interval. This makes for faster response times to problems but also allows us to see changes at a more minute scale.
To bring Nagios data into Loggly, I wrote a short script that reads a performance data file, reformats the information as JSON events, and bulk sends them to our collectors. I made the nagios2loggly.sh script available as an open source gist.
In our environment, we are effectively telling Nagios to use two performance data systems, so we need to fool it a little bit. We leave the existing configuration in place for pnp4nagios to utilize the service_perfdata_file and associated settings and instead write our performance log file through the service_perfdata_command setting.
More specifically:
- Open your nagios.cfg file in your favorite editor and make sure that process_performance_data=1 is set and add the line: service_perfdata_command=perfdata-to-loggly
- Save and then create a Nagios configuration file in conf.d (e.g. /etc/nagios3/conf.d/nagios2loggly.cfg) with the following content:
Please note that everything set on command_line above should be on one line and has horribly wrapped itself into near unreadability.
Once this file is save create the log directory (mkdir -p /var/spool/nagios2loggly) and make sure that it is owned by the Nagios used (chown nagios /var/spool/nagios2loggly). At this point you should be able to reload Nagios and start to see service performance data in the perfdata.log file.
Now that Nagios is writing performance data to a log, we can start moving it into Loggly. Copy the nagios2loggly.sh script somewhere on the server where the Nagios user can run it (e.g. /usr/lib/nagios/loggly/). Next open up the nagios2loggly.sh script in your favorite editor to update the token variable with your account token and optionally add any tags you wish to append to your log events. If you are writing your performance log file to a different location than specified earlier, then you will need to update the script with this information as well. You can manually run the script as follows:
If everything goes well, there will be no output save for a log file in /tmp/nagios2loggly.log if DEBUG=1 was set in the script.
At this stage, it would be reasonable to configure a cron job to regularly process the performance data and send it into Loggly. In our configuration, we have the file /etc/cron.d/nagios2loggly with the following entry:
Those are the basic steps to get Nagios performance data into Loggly. With the increased visibility into system performance tied to events in the logs, DevOps and engineering can get a better handle on the robustness and scalability of their applications. We can see where the bottlenecks are faster and focus our attention on what will help based on metrics rather than just gut instinct. This saves a lot of time, effort, and energy and in the long run makes for a better user experience. In later posts, I will go into detail as to how we take the Nagios, application, and performance data input into Loggly to gain insights into Apache Kafka queues, Elasticsearch behaviors and to measure our pipeline performance.
The Loggly and SolarWinds trademarks, service marks, and logos are the exclusive property of SolarWinds Worldwide, LLC or its affiliates. All other trademarks are the property of their respective owners.

Hoover J. Beaver