Remove Dashboard Blind Spots with Dynamic Field Explorer
Operating a Complex Web Application Requires a Bird’s-Eye View of Logs
When you’re running a cloud-based service in production, there’s a lot that can go wrong – and likewise, a lot to keep your eyes on. Most developers and operations professionals understand that summaries of “what’s going on” are more valuable than trying to make decisions by watching a raw stream of log events. That’s why many people like to start troubleshooting using operational dashboards.
Operational Dashboards Are Effective for Monitoring the Known and the Likely
Dashboards are a great way to keep track of a defined group of conditions or key performance indicators that keep you abreast of your application’s health. They’re a common entity in nearly any analytics tool and generically are meant to show you at a glance anything you regularly search for ( error counts, server utilization, feature usage, etc over time) or have as part of your “sanity check” to be confident in the health of your service.
However, dashboards have an important limitation: They are summaries of static queries or measurement you set up in the past. That is, you need to know ahead of time what to track and measure. And not all operational problems will manifest themselves through these known data points since perhaps they never happened before or you arent specifically looking for it.
Hence, your awesome, curated dashboard inherently always has some blind-spots.
Dynamic Field Explorer Exposes the Known and the Unknown
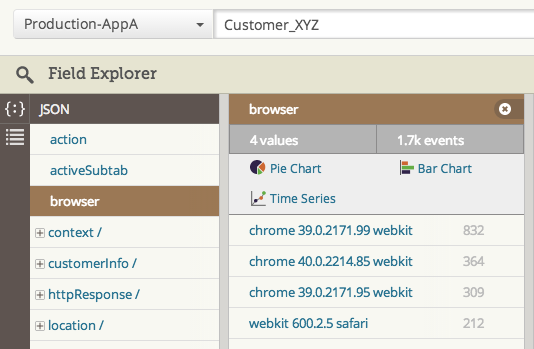
Loggly Dynamic Field Explorer generates real-time log summaries that give you insights about the known, the likely, and even the unknown. This is possible since all data we ingest gets processed through our Dynamic Fields engine, which will automatically catalog and do some quick analysis on your data. This means by the time you log in you have access to real-time summaries of the fields and values in your data, even if you are looking at a custom subset of your logs (i.e you’ve already searched or filtered).
These summaries are really useful for:
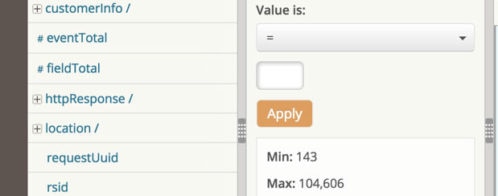
- Operational troubleshooting: With Field Explorer, you’ll see what metrics are emerging or shooting up in value right now. You’ll also be able to drill down and look at the see specifics of event counts and the actual logs that underlie the metrics.
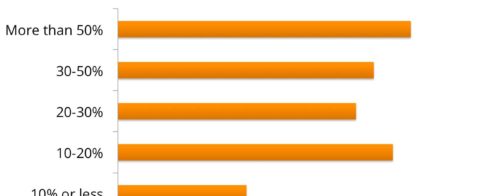
- Quick assessments of whether an issue is a bug in the code or an operational issue: As I demonstrated in one of my earlier posts, Field Explorer makes it quick and painless to figure out how widespread or isolated a particular issue is.
- Determining the magnitude of an issue: Likewise, you can very quickly figure out which servers or users are feeling the effects of an issue so you can proactively communicate and prioritize responses.
- Instant, automated sanity checks: In my earlier post, I also talked about how Field Explorer makes it much more practical to do “sanity checks” on what’s happening with your application. You don’t have to figure out which queries to set up (and usually get low payoff because you’re probably just confirming something you already expected), and you don’t have to suffer through the tedious process of running these queries one at a time.
How Field Explorer and Dashboards Complement Each Other Best
Here are the recommendations I give customers about how best to use Field Explorer and Loggly dashboards to keep their applications running at their best.
- Set up dashboards for:
- Log metrics that monitor the performance of your application and key components
- Each SLA with your business owners
- SLAs for key third-party services that you leverage
- Tracking regressions and bugs (as measured by errors and exceptions, timeouts, etc.)
- Use Field Explorer for:
- Day-to-day operational troubleshooting: Field Explorer makes you more productive in tracking down all sorts of issues, and it should be the first place you go for insights
- Ad hoc sanity checks after releases or whenever you desire
If you don’t yet have your Loggly account, you can put my recommendations into place really quickly by starting a free trial. If you’re an existing Loggly customer, be aware that you’ll need a Standard, Pro, or Enterprise account in order to create dashboards.
The Loggly and SolarWinds trademarks, service marks, and logos are the exclusive property of SolarWinds Worldwide, LLC or its affiliates. All other trademarks are the property of their respective owners.

Hector Angulo