Two Use Cases Showing Why Real-time Summaries Are Your DevOps Treasure Map
Every DevOps professional wants a faster path to finding the “treasure” in their logs: the small, sometimes scattered and hard to find set of log events that explain what’s happening with a given operational problem. A lot of software vendors are working hard on giving their users bigger and more powerful tools for finding that treasure – in other words, more powerful metal detectors with new knobs and levers you have to learn how to use. At Loggly, we are taking a different approach.
Loggly Dynamic Field Explorer is a Real-time Treasure Map, Not a Better Metal Detector
Loggly isn’t just aiming to create a powerful tool that is only useful if you master all the bells and whistles. Instead, we want to do everything in our power to help you fix operational problems as fast as possible. If that means we do a bit of the work for you so you don’t have to, even better! This is why we focus our efforts on giving users the equivalent of a treasure map for their logs: Surveying what’s there, summarizing what we find, and making it easier to see anomalies so that you always start with insight and get powerful context even if you only do basic queries. Our launch of Loggly Dynamic Field Explorer™ back in October was a big step in this direction, and there’s a lot more to come.

The great thing about Dynamic Field Explorer is that its always giving you automated summaries of your logs without you having to ask for it. If you prefer to use the search bar, there’s no disruption to your current flow. However, if the data presented in Dynamic Field Explorer piques your interest, you can immediately start interacting with it and experience this whole new way of looking at your logs. To best illustrate, I’ll cover two use cases that show how the treasure map of log data provided by Dynamic Field Explorer can help you expedite your quest for operational greatness.
Use Case #1: Initiate Operational Troubleshooting by Navigating Summaries of Your Logs, Not Searching Them
Dynamic Field Explorer is a huge time saver in the early stages of operational troubleshooting because you’re never starting with a blank map of your logs. Instead, you’re working from automatically generated insights based on what happened recently. You also have one-click access to our Trends feature so you can see the data as a graph over time, exposing even more insight.
Let’s look at a real-world example. If you are sending your Apache logs to Loggly, we will automatically extract and summarize key attributes of the log events such as the host that it came from, URL accessed, and its status code. You would see a listing of all the metadata from those events below even before you execute a single query:
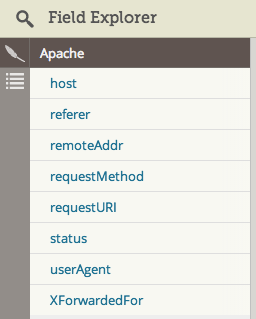
You can click on any field to instantly display all the values detected in your logs, listing from most common to least common and giving you a count of how many events that value was found in.
From here, you can do several things to further your analysis without typing a single query:
1) Instantly filter to view logs for a subset of the values (e.g. only 404’s and 500’s), knowing ahead of time exactly how many you expect to see.

2) Change the search context to a wider or smaller time range to see how the aggregate counts and distributions change.

3) Instantly graph (pie, bar, timeline) any of the values over time to get a visual context for when issues started happening or when they were resolved.

4) Do a grouping analysis such as “What URL’s are the 404’s coming from” by clicking on the “requestURI” field in Dynamic Field Explorer.

These steps are just a taste of all the powerful and effortless insight you can get from Dynamic Field Explorer. Key things to note:
- I didn’t have to type a single query to get any of the insights above.
- I didn’t have to know that I was looking for before when I started.
- All the summaries are automatically updated with the latest search context (i.e time change, filters, etc.).
- It look only a few seconds to get the list of URLs because Loggly had already parsed my log data.
- Combining the instant summaries with your knowledge of what these distributions “should” look like will help to quickly expose anomalies in your environment.
- This troubleshooting approach will work with all types of data, not just Apache logs. Loggly automatically parses fields from many log types, and the insight grows exponentially when you send your logs formatted in JSON.
Use Case #2: Super-charged Context During Your Manual Searches
Let’s say that you are troubleshooting a specific error but don’t know how common it is. You can search for that error and then use Dynamic Field Explorer to gain more context around the term:
- Which browsers are affected?
- How many sessions/ servers are affected?
- Which users are affected?
- etc
Let’s say that I’m troubleshooting a client timeout issue. I can search as I normally do through the search bar but quickly get deeper insight by using summarized breakdowns in different areas delivered by Dynamic Field Explorer.
Below you can see that Dynamic Field Explorer automatically lists all the fields that exist in events returned for my “client timeout” query. I have selected the browser field to get some further analysis:

I can quickly see that the majority of users experiencing this issue are on Internet Explorer (“msie 10.0”). My next question may be how this compares to the breakdown of browser usage by all my users to get a feel for areas of impact. This is easily done by just removing the “client timeout” search term and hit refresh and all the summaries and visualizations will update accordingly.

Very different indeed. Very quickly, without constructing any complex queries, I have some useful insight. I know that the issue is largely affecting IE users but, as my second search shows, IE 10 users don’t even show up in the top 10 browsers used by my customers. However, some Chrome users are also affected, and that is my top browser. I can use this insight to help prioritize the fix or impact accordingly.
As you can see in the example above, the more custom data you are logging, the better the context that Loggly will automatically expose. The real-time analytical capabilities of Dynamic Field Explorer provide you with a level of insights beyond just find-and-fix use cases, extracting answers to some key questions like:
- Is Error X happening more often on Chrome vs Firefox?
- What’s the list of all the customers that are also having this specific problem I just found?
- What’s the revenue impact of this problem (e.g. total value of failed transactions)?
- How popular is the new feature we just deployed?
- Are more or fewer people using feature X after the recent redesign/code change?
- Is feature Y used more often at any particular time of the day?
- How much revenue is being impacted by this problem (i.e, etc)
I’ll talk about custom logging in JSON in more detail in a future post.
In the meantime, make sure you take advantage of these automated treasure maps that Loggly Dynamic Field Explorer provides with every operational troubleshooting session. You’ll be glad you did.
The Loggly and SolarWinds trademarks, service marks, and logos are the exclusive property of SolarWinds Worldwide, LLC or its affiliates. All other trademarks are the property of their respective owners.

Hector Angulo