Five Best Practices for Proactive Database Performance Monitoring

Database monitoring is a critical part of any application’s maintenance. Finding database issues in time can help the application remain healthy and accessible. Without solid monitoring in place, database outages can go unnoticed until it’s too late and the business is losing money and customers.
Like any operational monitoring, databases can be proactively or reactively monitored, with proactive monitoring favored by most people. Proactive monitoring seeks to identify any issues before they become major problems. It’s done by looking at database metrics and alerting teams or individuals when values are abnormal.
Reactive database monitoring is done after an incident occurs. It’s usually done for security breach investigation, performance troubleshooting, or major incident reporting.
In this article, we will talk about the top five best practices for proactively monitoring database performance. Although the examples here are based on Amazon Aurora MySQL, the takeaways are applicable to any database.
1. Monitor Availability and Resource Consumption
This first step of proactive monitoring is to check whether all databases are online at regular intervals. This should be done during business and non-business hours. It’s the most basic and important test; everything else can come after this. However, there shouldn’t be any need for manual checks: a good monitoring tool should automatically alert an outage.
Sometimes, a multi-node cluster may experience failover. The application may still be up but running on a single database node. Since a subsequent database failure can take the app down, it’s necessary to check all nodes in a cluster.
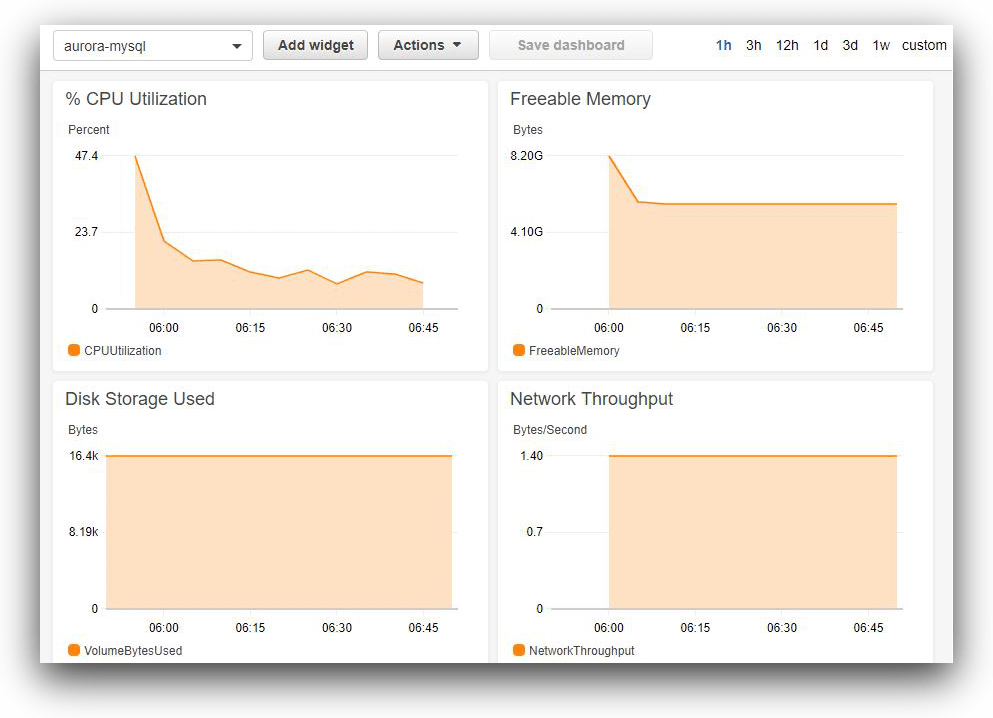
If nothing is offline, the next item to check is resource consumption. In this case, resources are mainly infrastructure related, like CPU, memory, disk, and network. Once again, well-planned monitoring should send alerts about high CPU, low memory, low disk space, or abnormal network traffic before they become problems.
For AWS-hosted solutions, this type of monitoring can be easily done with CloudWatch metrics, alerts, and dashboards. Even a simple dashboard like the one shown below can be useful:
2. Measure and Compare Throughput
Throughput refers to the amount of work the database is doing under normal working conditions. Typical examples of throughput metrics are “completed transactions/second,” “number of connections/second,” “queries waiting for disk IO/second,” or “replication latency,” to name a few.
Throughput measurement is part of regular monitoring. There’s no specific category for it. What and how a metric is measured today can be used as a comparison baseline tomorrow. Any significant deviation of the current reading from a baseline will call for further investigation.
The time to create a throughput baseline usually varies. It’s best to take multiple readings at different times of production over two weeks or a one-month period.
Normal operation baseline figures can be also used as alert thresholds. For example, if the average number of database connections per second is 20 during normal operating hours, a monitoring tool can fire off alarms if the connections are consistently above 30 for more than an hour, for example.
Also, database throughput should be a part of application capacity measurement.
For example, an application performance monitoring (APM) tool like SolarWinds® AppOptics™ might show that a microservice GET request against a DynamoDB table is executed 50 times per hour. This figure can be paired with the DynamoDB metric “SuccessfulRequestLatency” to show average response time (in ms) during the same period.
The image below shows an Aurora MySQL throughput dashboard created in AppOptics:
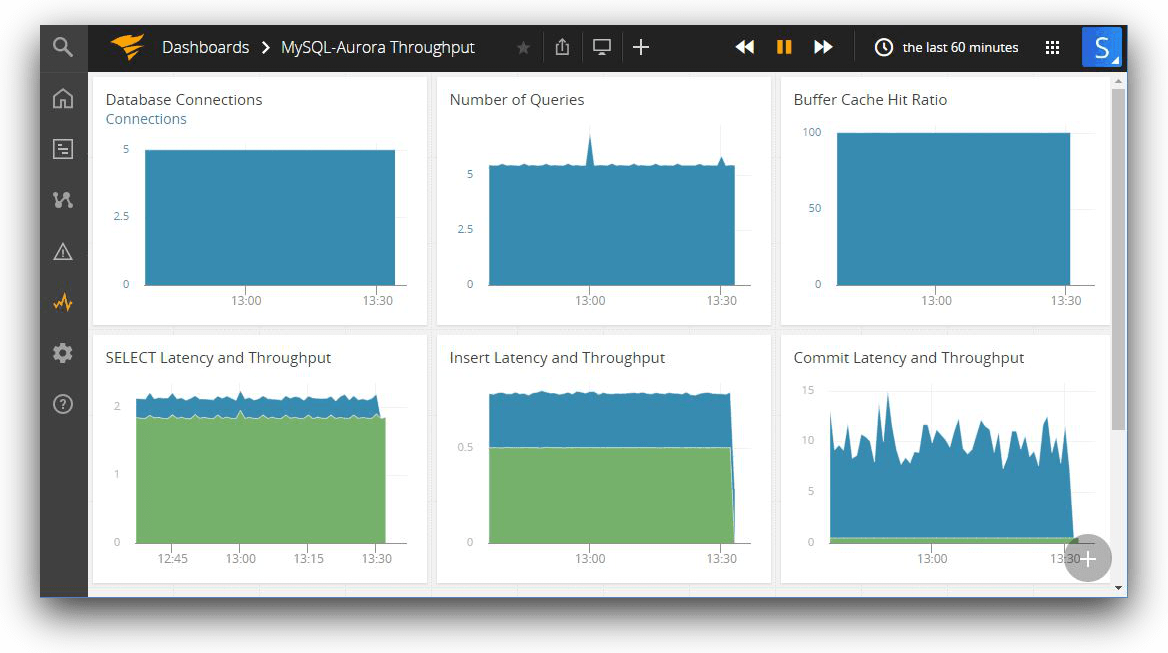
A steady, consistent pattern of any of these metrics represents a baseline throughput. A sudden, large variation from normal value would mean a change.
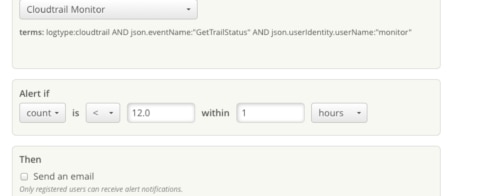
3. Monitor Expensive Queries
It’s still possible to get poor database performance when everything is online and resources are not under pressure. This can happen for a number of reasons, including inefficient query plans, data skew, non-existent indexes, unmanaged database statistics, poor database design, blocking, or database schema changes. Troubleshooting these types of problems is usually harder and requires a certain degree of knowledge about database internals. It involves looking at query plans, joins, or filters used by the database query optimizer.
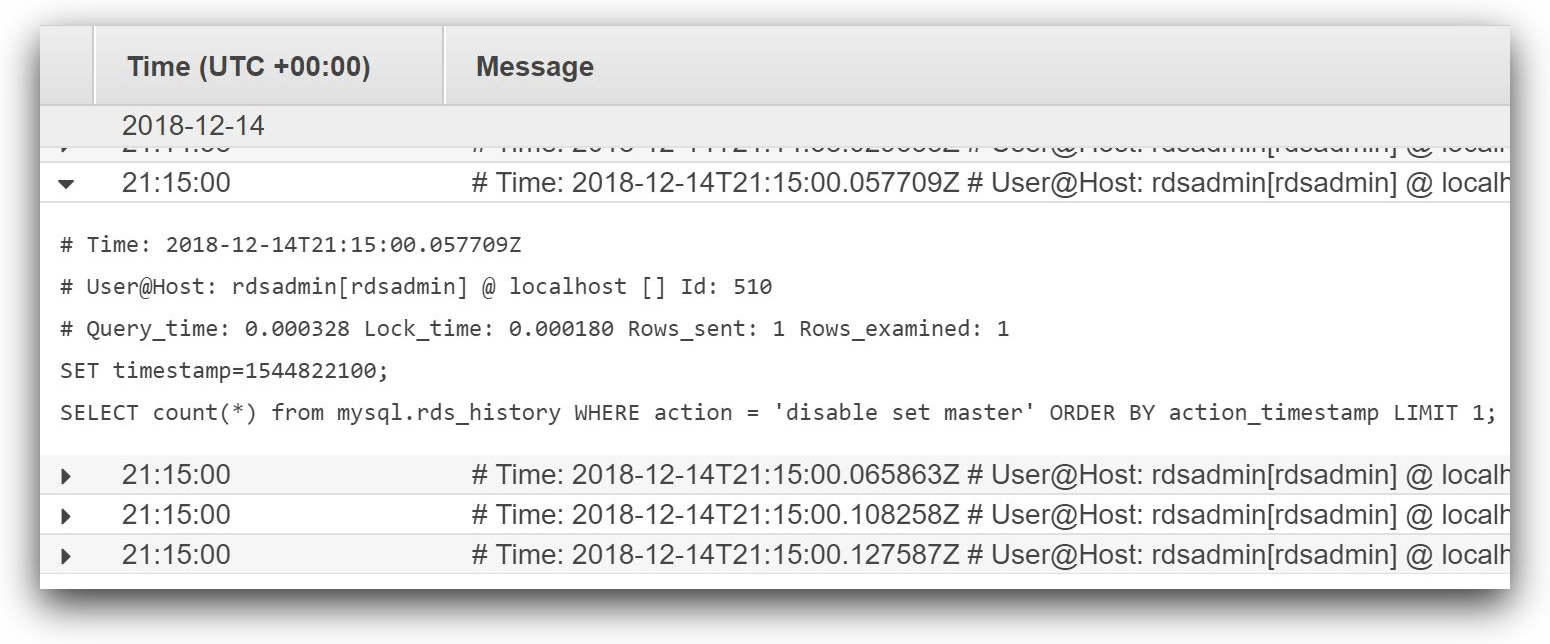
Troubleshooting database performance for expensive, or slow, queries starts with finding the queries that take a long time to run. These can be found from database logs, provided the database is configured to capture slow queries. Once slow queries have been identified, further analysis can begin.
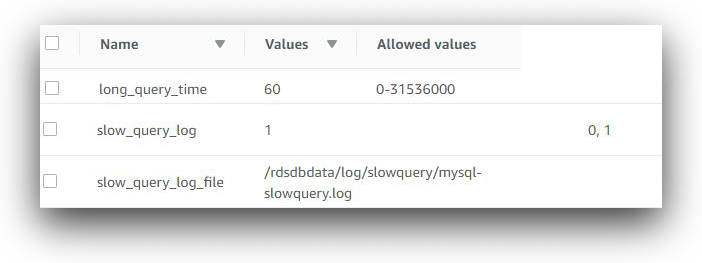
The image below shows three configuration parameters for recording slow queries in Amazon Aurora MySQL. First, the parameter “slow_query_log” is set to 1. This makes sure slow queries are written to a log file. The log file name is already set by the “slow_query_log_file” parameter. The parameter “long_query_time” is set to 60, which means queries taking 60 seconds or more to finish will be written to this log.
When enabled, a typical entry in a slow query log looks like this:
|
Here, the Query_time field shows the actual time in seconds taken to run the SQL statement. The log event also shows the number of rows returned and the number of rows examined.
Once you identify the slow running queries, you can analyze them for improvement. Most databases come with their own query analysis and tuning advisors. These tools can easily show large resource consumption by queries, long wait times, or missing indexes. It’s best to use the native database tools for in-depth query analysis wherever possible.
To minimize slow queries, it’s best practice to audit unused large tables, bloated indexes, tombstone records, or orphan connections. Database maintenance jobs can automate such audits and remediation. Once scheduled maintenance routines are in place, you should monitor them like any other regular job.
Let’s consider the slow query event viewed from CloudWatch Logs in the image below. As you can see, there are other events in the slow query log and it’s hard to go through each one and find the actual picture.
If we stream slow query logs to a central log management solution like SolarWinds Loggly®, we get access to features like the ability to parse these messages into fields and visualize changes over time. The charting feature of Loggly can show if a query is always running slowly during a particular time of the day and normally at other times (we show an example of Loggly charting below). Another example is finding queries that used to run quickly before that run slowly after a certain date. In both cases, the DBA will have meaningful reference points.
Configuring MySQL to send slow query log to Loggly is really simple. Tools like AppOptics can be used to view application and database performance side-by-side on a per-request basis. This helps identify if a slow response is due to the database or something else in the stack.
Another tool to consider is SolarWinds Database Performance Analyzer (DPA). Organizations often run multiple database platforms in their network and this is where DPA can shine. It’s designed to work with common databases like SQL Server, MySQL, Oracle, or DB2. The tool analyzes each step between a database query request and its response, and finds where the maximum wait is happening. Like native database tools, DPA also offers indexing and query tuning advice.
4. Track Database Changes
Agile development continuously evolves modern applications and not surprisingly, these changes can affect database performance. A new version of an application might add, modify, or drop database objects like tables, functions, or views. A new data source might add millions of rows in a table without partitions. A wrong optimization step might add an extra index to a table, causing significant query delays.
Events like these need to be monitored for potential impacts. There are two ways to do this: the first method is to create a throughput baseline immediately after any change. This helps to compare the before and after picture of database performance. The second method is to monitor database schema changes as they happen. Changes can be tracked from database logs if the logs are capturing data definition language (DDL) queries. DBAs can create alerts on schema change events like CREATE, ALTER, or DROP events. Any performance change following such events can give a good starting point for investigation.
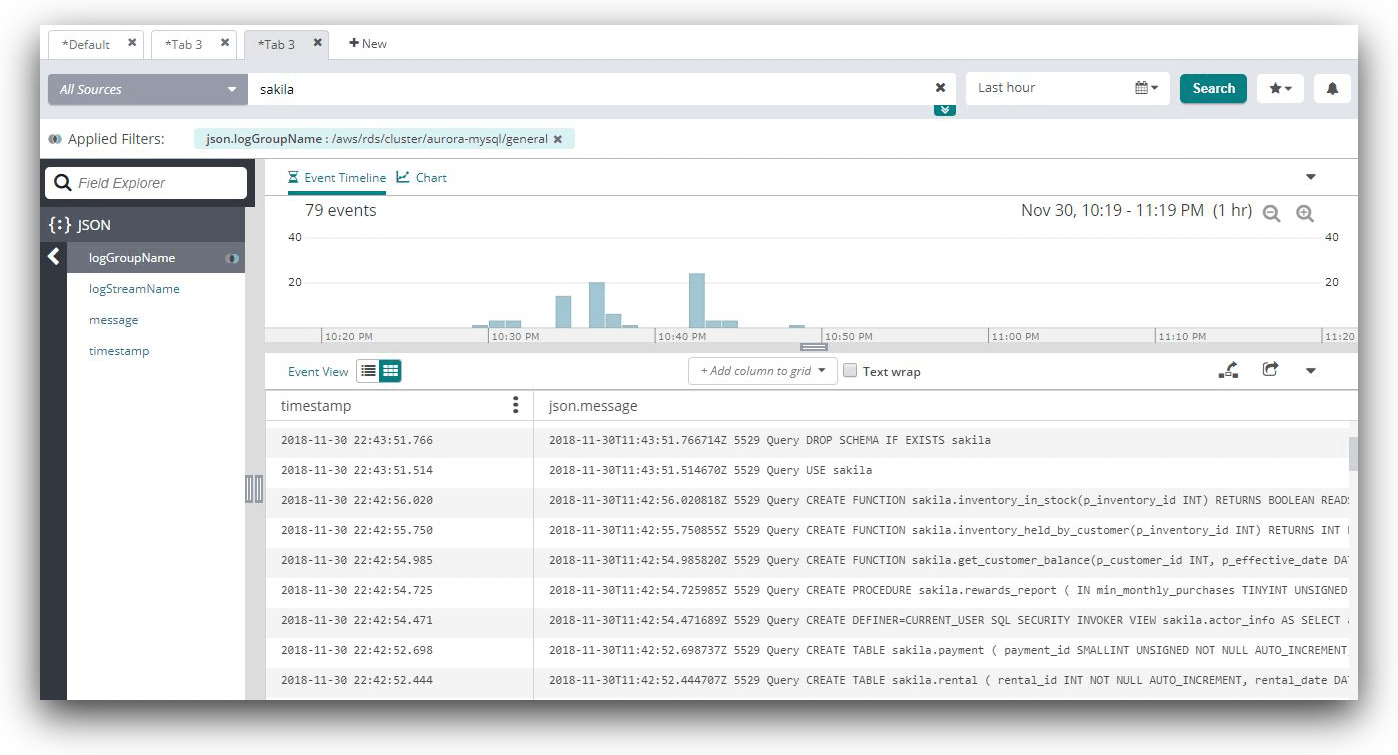
Once again, Loggly can help users easily find database changes. The image below shows how an Amazon Aurora MySQL general query log is searched. In this case, the log events are searched for a database called “sakila”. The results show a number of objects being created in the database:
5. Monitor Logs
Database logs play a vital role in proactive monitoring. Logs contain valuable information, most of which are not available in performance metrics. For example, the “average number of queries/second” metric doesn’t show which specific queries are consistently running slow. A database log can show all the queries running in the database and how long each is taking to finish.
For best results, all logs from the database environment should be collected. This not only includes system-generated logs, but also slow query logs, scheduled task logs, backup logs, and maintenance routine logs. The more logs are collected, the better.
The length of time for which these logs are kept depends on a number of factors. Legal compliance may require database logs to be available for many years. Sometimes the choice of log retention period is affected by financial decisions, production vs. non-production systems, or importance.
A busy database system can generate hundreds or thousands of events every minute. Manually parsing the logs to find important events is not feasible. That’s why it’s best to create visual representations from log events like charts and dashboards to get an overall picture. For example, Amazon RDS enhanced metrics are sent as JSON-formatted logs to CloudWatch. It’s possible to create CloudWatch metrics from these events and use those metrics as widgets in CloudWatch dashboards.
Other solutions like Loggly can add even more value to log monitoring, including drilling down into log events with Dynamic Field Explorer, creating derived fields, or watching log streams live. You can send CloudWatch logs containing RDS enhanced metrics to Loggly and use Loggly to monitor RDS performance.
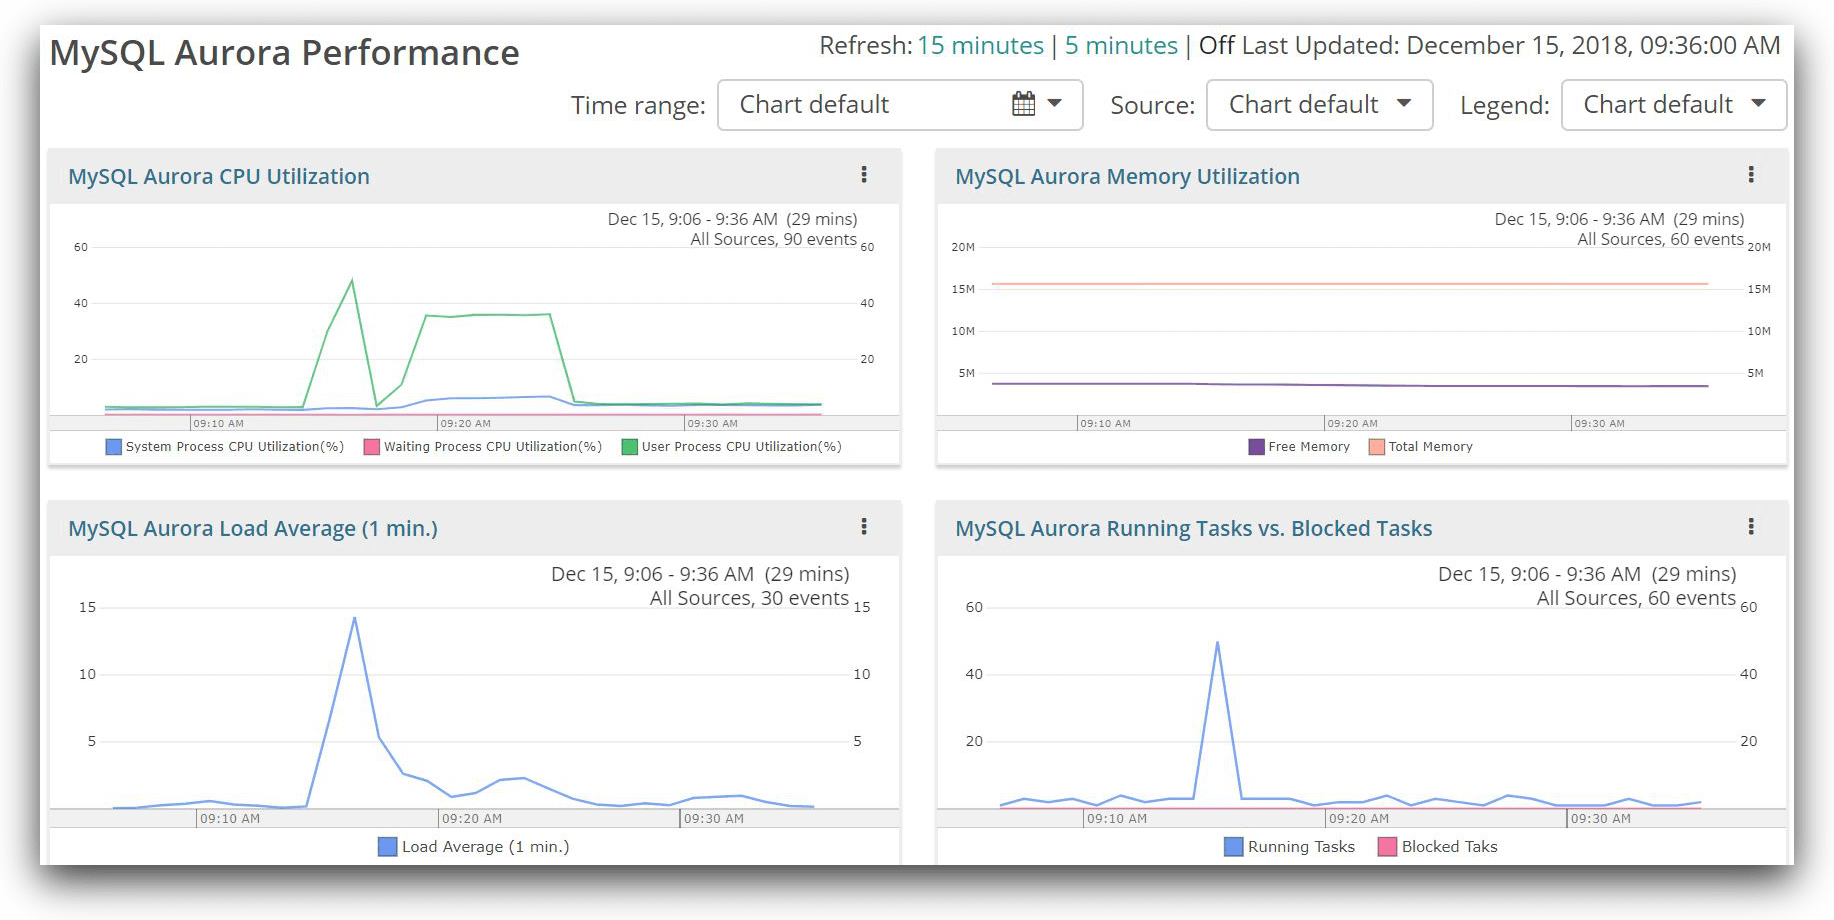
The image below shows one such performance monitoring dashboard in Loggly, created from RDS enhanced metrics. The widgets in the dashboard were created using the derived field feature of Loggly.
Conclusion
There is no specific order of implementation for these five best practices. Organizations can start from anywhere. The ultimate goal should be to bring everything under monitoring. Something is better than nothing; an ounce of prevention now may help avert a major outage later.
For AWS-hosted infrastructure, database monitoring should be aligned with the broader resource-monitoring strategy at some stage. We put together a guide on four stages of successful AWS resource monitoring that you can follow.
Industry leaders like SolarWinds can offer best-of-breed tools for an enterprise’s monitoring needs. AppOptics is a great tool for database, infrastructure, and application monitoring, while Loggly is great for log management. Both applications are interoperable with each other. To see how Loggly can help monitor databases, sign up for a free trial.
The Loggly and SolarWinds trademarks, service marks, and logos are the exclusive property of SolarWinds Worldwide, LLC or its affiliates. All other trademarks are the property of their respective owners.

Sadequl Hussain