Logging and Metrics: Better Together
Logging and metrics may sound interchangeable, and you may think the information from one can be used in the same way as information from the other. But the reality couldn’t be further from the truth. Logging and metrics are two concepts you must use both independently and together to ensure your infrastructure and applications operate at their best.
In this article, we’ll deploy an example application to DigitalOcean—a platform as a service (PaaS) provider designed to make it easy to deploy and spin up apps. We’ll use both SolarWinds® AppOptics™ and SolarWinds Loggly® to collect our metrics and logs.
Our app will be distributed across three global regions. This type of application is a difficult one to understand without some aggregation function for our data, and it’s impossible to correlate the data without centralized logging filters and metrics heuristics. It’ll be a perfect example for highlighting the differences between logging and metrics. Once we’re done, you’ll see how using logging and metrics together works better than using them individually.
Our App
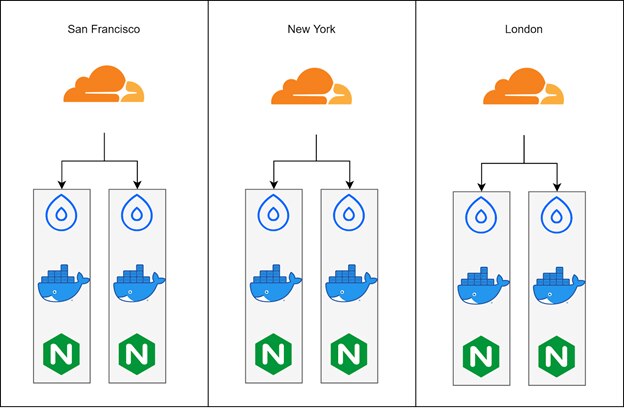
The application is simple: it’s just an NGINX page hosted in a container on a DigitalOcean Droplet backed by Cloudflare edges for geo distribution.
Out of the box, DigitalOcean gives us a few ways to look at the overall health of our services.
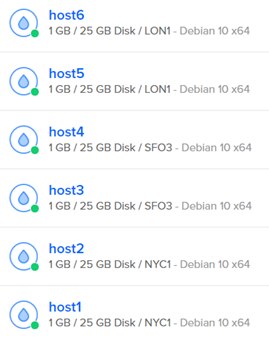
The most obvious one is the initial dashboard, which shows the overall health of each server. These indicators may or may not have any bearing on the applications themselves.
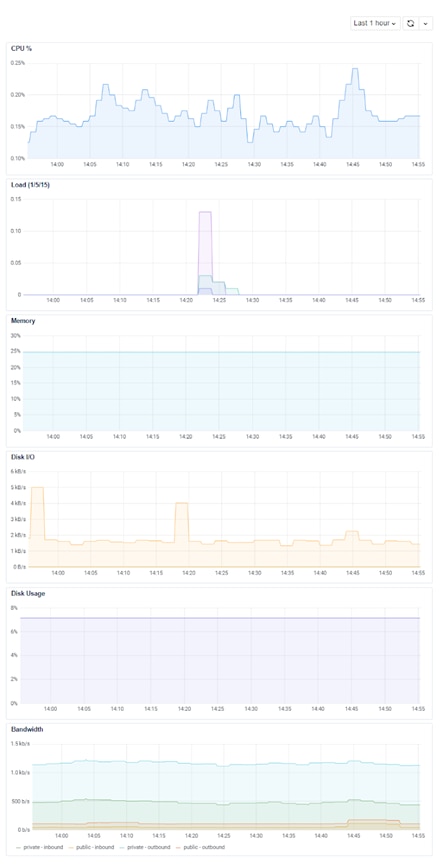
Digging into each of these, we can see additional server-level metrics over time.
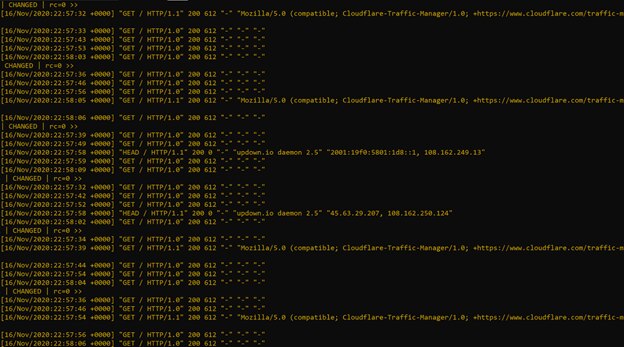
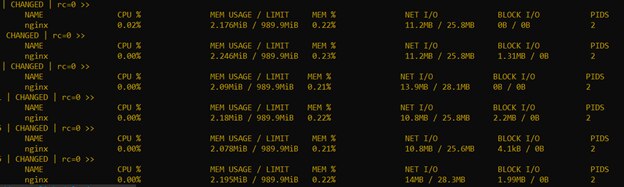
And finally, to grep our logs, we can use tools like Ansible to quickly iterate across our server lists and get a general idea of what’s happening to our applications.
Difference Between Logging and Metrics
We have some information now, but we can see how logging and metrics don’t individually tell us the whole story.
By themselves, application logs are inadequate for identifying trends, heuristics, and pattern matching. Setting alerts and escalations based on every error can quickly become tiresome. Worse, this tedious work can eventually get ignored. Even specific errors may not be useful on their own. By itself, logging can’t describe the quantity of a problem without significant processing, and it’s incredibly difficult to correlate based on errors alone.
Metrics don’t tell the whole story of a problem either. They can’t explain the cause or rationale of a trend, since metrics don’t provide a holistic view of a problem. They only show a value is higher or lower than normal. In a vacuum, metrics cannot describe the quality of the problem; they can only show some issue is occurring.
What Logging Does Best
Logging tells a developer or system owner what the problem is and how a customer might be impacted. “Disk Full” and “Gateway Timeout” are clear descriptions of a problem and shed light on how an end user might have experienced your product. Based on this data, we can clear space and allocate bigger disks or replace servers entirely.

But from something like this alone, we can’t narrow down a start time—nor can we easily identify the cause of such an error. It also leaves us without any real idea of how many people were actually impacted by such an error.
What Metrics Do Best
Metrics are useful for telling owners when or where a problem may be occurring. These are usually summaries of logs or of system and application performance. A seven-day trend of 20% memory utilization and a sudden spike to 80% memory utilization tells a story of impending impact or systemic regression that might otherwise look completely normal.
Consider our example above with the “Disk Full” errors. If we zero in on the host, we can get a general idea about what happened:
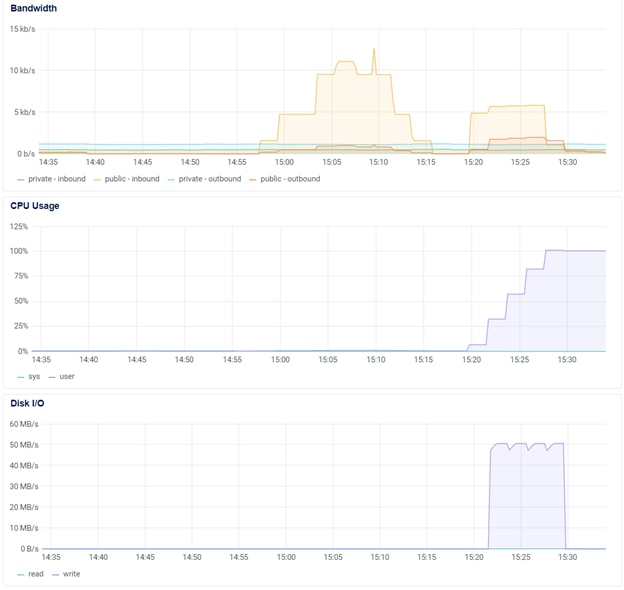
And while this data is clear as to what kind of problems might be seen, the behavior on the site in our design masks this problem. Unfortunately, there’s nothing telling us to look in this direction except for a curated disk-fill command to instigate it.
How Logging and Metrics Analyses Supplement Each Other
Logging is useful broadly, but it’s extremely powerful when a user knows when a problem occurred and where it happened. Additionally, new errors may be a great indicator when performing metric behavior analysis. Tracking down a problematic error by further reviewing metrics can indicate deployment problems, hardware faults, or even user behavior changes.
Let’s take a closer look at how combining and centralizing the concepts of logging and metrics can help us determine a clearer, timelier picture of our problems. We’ll use Solarwinds AppOptics and Loggly to see both our logs and metrics, giving us a much more thorough understanding of our app.
To pull our logs together, we’ll need to change the infrastructure a bit from the out-of-the-box, one-at-a-time methodology and instead add exporters to our platform.
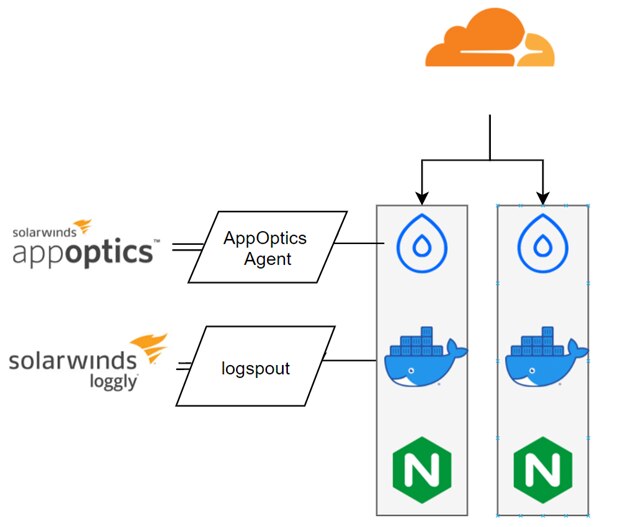
SolarWinds provides simple one-line commands to add this functionality to our system, and I just used the same Ansible automation from earlier to run our one-liners across all our Droplets:
$ sudo bash solarwinds-snap-agent-installer.sh --token <your api token> [--yes] [--debug]
docker run --name logspout -d --volume=/var/run/docker.sock:/var/run/docker.sock -e SYSLOG_STRUCTURED_DATA="TOKEN@41058 tag=\"Logspout\"" gliderlabs/logspout syslog+tcp://logs-01.loggly.com:514
We could’ve made this even simpler by using the SolarWinds agent to also collect the logs, but this will work for our current tests.
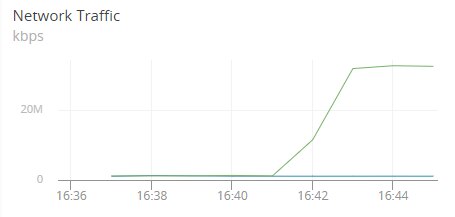
Using the AppOptics dashboarding, we can see aberrant behavior from one of our hosts. It spikes massively in CPU, with a big jump in disk I/O and no additional disk capacity starting at 16:38.
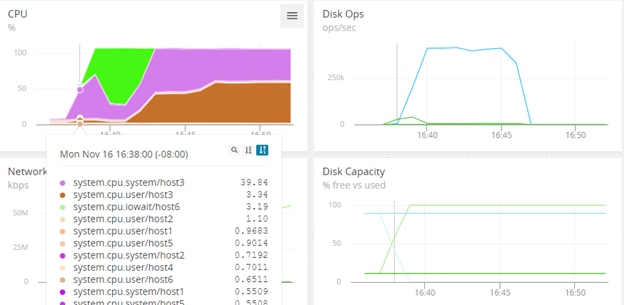
Network traffic doesn’t look like it’s increasing fast enough to account for such a sudden wave of I/O usage and disk space utilization:
With the logs now in the sister application Loggly, we can zoom in on the 16:38 aberration and see what the applications were doing on host3:
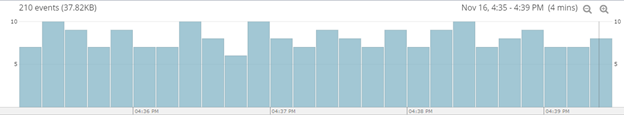
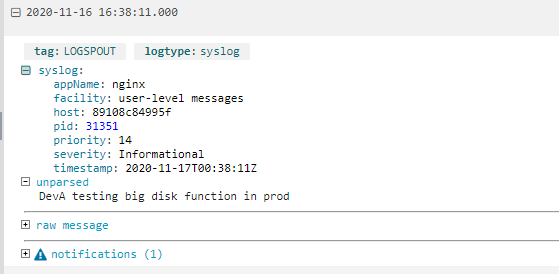
Here, we have an immediate and clear picture showing :
- Something happened on just one node (host3) in our infrastructure
- It was caused by a developer running a job at a specific time (16:38).
With this information, it’s now only a short trip to the change management platform or a brisk walk to the developer’s desk to learn why this occurred. Follow-up can occur according to your company’s standard problem management policies and procedures.
Conclusion
Logs or metrics by themselves are insufficient, but together, they’re the most powerful functions in an administrator’s arsenal. Whether you’re running a simple Node.js application or hosting enterprise-grade infrastructure, combining the power of SolarWinds products with DigitalOcean creates an environment where you’re informed and prepared.
The Loggly and SolarWinds trademarks, service marks, and logos are the exclusive property of SolarWinds Worldwide, LLC or its affiliates. All other trademarks are the property of their respective owners.

Loggly Team