Technical Resources
Educational Resources
APM Integrated Experience
Connect with Us
Extracting data from log files can be tricky, but it can also provide insight into the performance and usability of your application. There are several utilities for digesting and presenting log data in the form of lists, tables, charts, and graphs. These include basic text processing tools such as grep or sed to more advanced desktop and web tools designed to parse almost any log format.
This section explores some of these utilities and how you can use them to extract more data from your logs. Although we’ll demonstrate the use of command-line utilities, we recommend using a log management solution such as SolarWinds® Loggly® to make log parsing and analysis much easier.
The JSON format makes it easy to extract data from log files since the data is already stored in a structured format. Each log entry includes the date and time of the entry, the name of the Logger that recorded the entry, and many other useful elements.
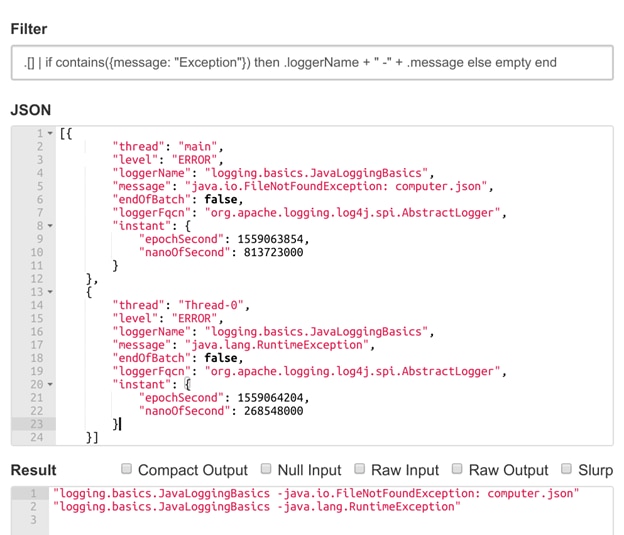
One popular open-source parser, jq, makes traversing JSON files simple and straightforward. In addition to a command-line utility, jq provides a web interface for testing commands. The following example reads a file called myLog.json and returns the Logger name and message for any entries that contain “Exception” in the message.
$ jq '.[] | if contains({message: "Exception"}) then .logger + " -" + .message else empty end' myLog.json

Extracting exception details from multiple JSON log messages. © 2022 the jq development team. All rights reserved.
You can then pipe the results into command-line tools such as grep and sed to format the results. You can also group and sort the results using the utilities sort and uniq. sort arranges the output, and uniq provides a count for the number of identical exceptions. For example, we can sort our results by Exception type in alphabetical order.
$ jq '.[] | if contains({message: "Exception"}) then .loggerName + "-" + .message else empty end' myLog.json | grep -o "w*-|w*Exception" | sed 'N; s/-n/ /' | sort -r | uniq -c
1 JavaLoggingBasics FileNotFoundException
2 JavaLoggingBasics RuntimeException
The sort, uniq, and advanced grep options are covered in more detail in the Parsing Multiline Stack Traces section.
Log management tools are built to process and store log data, making it easier to query, sort, and filter events. Instead of having to parse and provide the log data yourself using commands, the log management tool can parse the log data for you and provides the means to search or extract logs using simple commands.
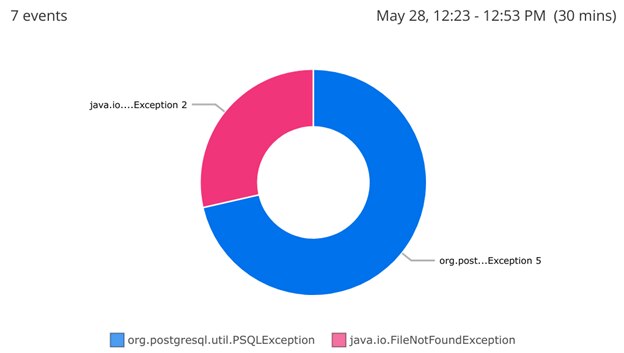
For example, imagine you want to find out which exception types are occurring most frequently. Using a log management service like Loggly, you can query your logs for messages containing “Exception,” then plot those logs in a pie chart to display their ratio. For example, we created the following chart in Loggly. Note there are more PSQLExceptions than FileNotFoundExceptions. Perhaps this will help us prioritize which bug to fix first?

Creating a pie chart of exceptions from log data. By logging additional fields such as the calling method, you can fine-tune your ability to query and traverse logs. You can find more information on log management tools in the Centralizing Java Logs section of this guide.
Like JSON, XML makes it easy to store and parse logs due to its structured format. The following is an example of an XML log created using java.util.logging:
<?xml version="1.0" encoding="UTF-8" standalone="no"?>
<!DOCTYPE log SYSTEM "logger.dtd">
<log>
<record>
<date>2015-04-03T16:04:44</date>
<millis>1428091484804</millis>
<sequence>0</sequence>
<logger>MyClass</logger>
<level>SEVERE</level>
<class>MyClass</class>
<method>main</method>
<thread>1</thread>
<message>An exception occurred.</message>
</record>
</log>
Log4j and Logback support exporting to XML via the XMLLayout Layout. To export Log4j logs as XML, set an XMLLayout as the Appender Layout in your Log4j configuration file. For example, we can write to an XML file using a FileAppender.
<File name="FileAppender" fileName="myLog.log">
<XmlLayout complete="true" />
</File>
While java.util.logging stores event details as elements, Log4j instead stores them as attributes. The same event recorded in Log4j generates the following XML.
<?xml version="1.0" encoding="UTF-8"?>
<Events xmlns="<a href="https://logging.apache.org/log4j/2.0/events">https://logging.apache.org/Log4j/2.0/events</a>">
<Event xmlns="https://logging.apache.org/Log4j/2.0/events" ti meMillis="1428091484804" thread="main" level="ERROR" loggerN ame="MyClass" endOfBatch="false" loggerFqcn="org.apache.logging.Log4j.spi.AbstractLogger">
<Message>An exception occurred</Message>
</Event>
</Events>
Command-line interface (or CLI) tools can also parse Java logs, but it can be challenging depending on the log format. Many command-line tools process individual lines of data simultaneously, whereas many formats spread a single log event across multiple lines.
For structured formats such as JSON and XML, you may be able to compress logs to a single line by enabling an attribute in your Layout configuration. For example, setting the XMLLayout compact attribute to true in Log4j will print each log on a separate line. JSONLayout also supports this attribute.
Alternatively, you can use a utility such as xml2 to convert your multiline XML logs. xml2 is a popular open-source library for parsing XML files. Parsing an XML log file to xml2 returns a list of nodes organized by their level in the XML document.
$ xml2 < myLog.xml
/log/record/date=2015-04-03T16:04:44
/log/record/millis=1428091484804
/log/record/sequence=0
/log/record/logger=MyClass
/log/record/level=SEVERE
/log/record/class=MyClass /log/record/method=main
/log/record/thread=1 /log/record/message=An exception occurred
xml2 works equally well when with parsing Log4j logs. Note that attributes begin with "@".
/Events/@xmlns=https://logging.apache.org/Log4j/2.0/events
/Events/Event/@xmlns=https://logging.apache.org/Log4j/2.0/events
/Events/Event/@timeMillis=1428502398194
/Events/Event/@thread=main /Events/Event/@level=ERROR
/Events/Event/@loggerName=MyClass /Events/Event/@endOfBatch=false
/Events/Event/@loggerFqcn=org.apache.logging.Log4j.spi.AbstractLogger
/Events/Event/Message=An exception occurred
We can reduce this further by using the sed command to remove the repeating text at the beginning of each line. sed, or Stream , is an open-source utility for manipulating text. In this example, we’ll use sed to replace each instance of /log/record/ with an empty string. The field to replace and its replacement value are delimited by a colon, which is defined by the s parameter. The g parameter indicates we’re performing this replacement for all instances of /log/record/, not just the first.
$ xml2 < myLog.xml | sed 's:/log/record/::g'
date=2015-04-06T14:42:40
millis=1428345760991
sequence=0
logger=MyClass
level=SEVERE c
lass=MyClass
method=main
thread=1
message=An exception occurred
While this is easier to work with, the data’s still split across multiple lines. We can fix this using tr, a Unix command for replacing individual characters in a block of text. Unlike sed, which works on only one line at a time, tr replaces characters across multiple lines. We can use tr to remove new-line characters by piping the outputs of xml2 and sed to tr:
$ xml2 < myLog.xml | sed 's:/log/record/::g' | tr 'n' ' '
date=2015-04-03T16:04:44 millis=1428091484804 sequence=0 logger=MyClass level=SEVERE class=MyClass method=main thread=1 message=An exception occurred
If xml2 displays only one entry, try setting the XMLLayout complete attribute to true in your logging framework’s configuration. If your log file contains multiple log entries, you may need to use an additional sed command to add a new line between entries; otherwise, the entire log file will appear on a single line. With java.util.logging, XMLFormatter places an empty /log/record between events. You can replace that empty record with a new line by adding | sed ‘s:/log/record :n:g to the end of the command.
We’ve essentially compressed an entire XML document into a single line, with each attribute identified by its shorthand name. This makes it easier to use tools like grep to search log files based on the results of one or more fields. This also makes it easier to parse the file, since it consists entirely of key-value pairs.
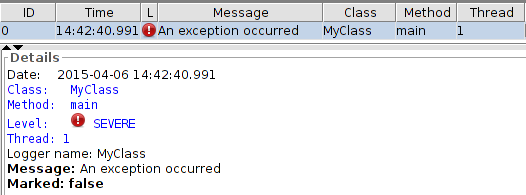
Desktop log viewers provide a visual interface for viewing and parsing log files. The benefit of these desktop log viewers is they can automatically parse and present log files in a way designed to make them easy to sort, search, and index. These tools also make it possible to filter entries based on specific criteria or display trends in the form of graphs or charts.
Compatibility with a certain tool depends on which Layout was used to create your logs. For example, JSON logs can be used by any number of JSON-compatible tools, while a PatternLayout may require a more specific tool. Make sure to read the documentation and supported formats for each tool.
Some of the more popular log viewers include:

Viewing an error log in OtrosLogViewer. © 2022 OtrosLogViewer development team. All rights reserved.
Stack traces add a layer of complexity to log files by splitting individual events across multiple lines. Many log parsing solutions interpret new lines as separators between events, causing stack traces to appear as multiple separate events rather than a single event. For a brief overview of exceptions, see Logging Uncaught Exceptions.
For example, the following code generates a stack trace by attempting to divide by zero:
import java.io.*;
import java.util.logging.*;
...
try {
int i = 1 / 0;
}
catch (Exception ex) {
logger.log(Level.SEVERE, "Exception: ", ex);
}
This results in the following output:
May 16, 2019 1:12:00 PM MyClass main
SEVERE: Exception:
java.lang.ArithmeticException: / by zero
at MyClass.main(MyClass.java:17)
The first line contains a timestamp, the name of the class, and the name of the thread that caused the event. The second line contains the log level and message supplied to the Logger. From the third line, we’re given the stack trace generated at the time of the exception. To extract data from this event, we need to treat every line as part of the same event.
An effective way to handle stack traces is to log in a structured format such as XML or JSON. However, if you are reading unstructured logs from a file, you can import those files into syslog using the rsyslog imfile module. imfile has a paragraph read mode that automatically detects individual log events in a file based on their spacing from each other. This can be used to identify stack traces, which are typically indented after the first line.
Once the log and stack trace are merged into a single event, you can begin parsing the rest of the log entry.
Regular expressions (often called regex or regexp) are patterns used to match one or more characters in a string. Regular expressions are supported by countless programming and scripting languages, applications, and utilities. You can find more information on regular expressions, including guides and tutorials, at Regular-Expressions.info.
Command-line tools such as grep allow you to search and parse files using regular expressions. Using grep, we can extract log data that matches the format of a stack trace by using a regular expression.
The following example searches each line in the myLog.log file for an exception. Let’s break down this grep command: the -e flag tells grep to match a pattern based on the regular expression provided. Exception: tells grep to match any files that contain the string “Exception:”. [[:space:]] at tells grep to return any lines that begin with whitespace followed by the word “at”. | tells grep to match on either condition, which lets it return lines that begin with “Exception” or “at”.
grep -e "Exception:|[[:space:]]at" ~/myLog.log
SEVERE: Exception:
java.lang.ArithmeticException: / by zero
at MyClass.main(MyClass.java:17)
The “Exception:” string in the regular expression is just an example. Any message logged by your logger can be used here. This also works for longer stack traces, such as the following FileNotFoundException:
SEVERE: Exception:
java.io.FileNotFoundException: notMyLog.log (No such file or directory)
at java.io.FileInputStream.open(Native Method)
at java.io.FileInputStream.<init>(FileInputStream.java:146)
at java.io.FileInputStream.<init>(FileInputStream.java:101)
at java.io.FileReader.<init>(FileReader.java:58)
at MyClass.main(MyClass.java:20)
Similar to the example shown in Structured Stack Trace Logs, you can use the grep advanced options to analyze stack traces. While the previous example used positive lookaround, this example uses negative lookaround to find instances of “Exception” that aren’t preceded by a space. Again, this could change depending on how your log messages are structured.
$ grep -oP "(?<! )w+Exception" ~/myLog.log | uniq -c | sort -r
1 FileNotFoundException
1 ArithmeticException
Several log management tools are designed to handle stack traces seamlessly.
Logstash® is an open-source data processing pipeline capable of ingesting, parsing, converting, and exporting log data. At the heart of its parsing capabilities is grok, which uses regex to split log events into individual tokens. Logstash provides around 120 grok patterns supporting some of the most common log formats.
In addition to grok, parsing stack traces requires the Multiline codec plugin, which merges log entries spread across multiple lines into a single event. An alternative is to use rsyslog with the imfile module, which also supports the ability to read multiline logs as single events before passing them onto syslog.
The following is an example of multiline configuration that treats stack traces as part of a single line.
codec => multiline {
pattern => "^[a-zA-Z]{3} [0-9]{2}"
what => "next"
negate => true
}
The pattern parameter is a regular expression that tells the filter how to separate log entries. By default, the java.util.logging SimpleFormatter records log entries starting with a three-letter month followed by the day. Each time the multiline plugin comes across this pattern, it creates a new event. The what parameter tells Logstash how the line containing the pattern relates to its neighboring lines; in this case, we pair it with the next line in the log file. Finally, the negate parameter tells Logstash to treat lines that don’t match the pattern as part of the same event.
Put together, this configuration tells Logstash to look for lines that contain the pattern and treat any of the following lines that don’t match the pattern as part of the same event.
Now that we’ve merged our stack trace into a single event, we need to tell grok how to parse it. Grok works by comparing the text of each event against predefined patterns. Logstash stores the log event in the message field, so we’ll tell grok to search for matches based on that field:
filter {
grok {
match => [ "message", "(?m)%{MONTH:month} %{MONTHDAY:day}, %{YEAR:year} %{TIME:time} %{WORD:time_of_day} %{WORD:class} %{WORD:thread}n{%WORD:level}: %{DATA:msg}n{%GREEDYDATA:stacktrace}"
]
}
}
This looks confusing, but it’s actually very straightforward. We’re breaking down each part of the event into an individual token and assigning each token a name. For example, %{MONTH:month} searches for a string that matches the pattern for a month name, then assigns “month” as the field the name. Using plain regular expressions, the same search would look like this:
b(?:Jan(?:uary)?|Feb(?:ruary)?|Mar(?:ch)?|Apr(?:il)?|May|Jun(?:e)?|Jul(?:y)?|Aug(?:ust)?|Sep(?:tember)?|Oct(?:ober)?|Nov(?:ember)?|Dec(?:ember)?)b
The result is the same, but grok’s predefined patterns make the process much easier and much less verbose. This same process applies to each of the following fields based on where they appear in the log event. The (?m) modifier at the beginning tells grok to treat the log as a multiline string.
Once the event is parsed, we can use Logstash to export it to JSON, resulting in a much more structured event.
{
"month": "Apr",
"day": "09",
"year": "2015",
"time": "1:12:00",
"time_of_day": "PM",
"class": "MyClass",
"thread": "main",
"level": "SEVERE",
"msg": "Exception: ",
"stacktrace": "java.lang.ArithmeticException: / by zero at MyClass.main(MyClass.java:17)n"
}
Much of the key information has been extracted, but the stack trace itself still contains a lot of data. Adding a few more grok filters will help break down the stack trace even further, allowing us to extract the exception type and location.
Note that Logstash might include the original log message as part of the JSON output. To suppress it, add remove_field => [ “message” ] to the grok filter.
Loggly is built to use predefined filters to automatically detect and parse stack traces into individual tokens, similar to Logstash and grok. The benefit is Loggly can do this automatically as it ingests logs from your application.
Compare the same ArithmeticException from above to the following screenshot, which shows the log as it appears in Loggly after being automatically parsed and indexed.

Viewing a stack trace in SolarWinds Loggly.
A Beginner’s Guide to Grep (Open Source For You) – Guide to using grep
Getting Started with Logstash (Elastic) – Guide to using Logstash
LogMX (LightySoft)
OtrosLogViewer Tutorial (Otros Systems)
Regular-Expressions.info (Jan Goyvaerts) – Regular expression tutorials and examples
Using Grep & Regular Expressions to Search for Text Patterns in Linux (DigitalOcean) – Guide to using regular expressions in grep
Grep Tutorial (Regular-Expressions.info) – Introduction to using grep for regular expressions
Last updated 2022