Technical Resources
Educational Resources
APM Integrated Experience
Connect with Us
Error logging and behavior monitoring is vital in any production application. This article demonstrates some techniques to analyze and monitor a Node.js/Express application with Winston and Morgan. We'll cover a few issues you might run into in production and how log management tools can help you find and avoid issues. Monitoring tools like SolarWinds® Loggly® make slicing log data, drilling down into specifics, and visualizing granular insights easy and fun.
Command line tools are useful for quickly retrieving logs or viewing a live feed of logs. This is especially useful during development so you can catch errors and warnings in real time. Although you can use command line tools in production, you’ll be limited to extracting important metrics on the server where your logs are stored.
This is a big limitation in dynamic or containerized environments where requests could be processed by any number of nodes and logs are not aggregated across them. It also requires complex parsing rules involving multiple commands. This makes monitoring logs in real time with the command line extremely difficult. Here’s the primitive approach using grep:
$ grep -o "GET /api/prices 200" .logs/logs.log
Here are some example default logs from the logging framework called Morgan:
2019-11-03T23:32:32.449Z PostmanRuntime/7.19.0 GET /api/prices 500 159 - 33.164 ms

2019-11-03T23:32:33.655Z PostmanRuntime/7.19.0 GET /api/prices 500 159 - 4.245 ms

2019-11-03T23:32:34.533Z PostmanRuntime/7.19.0 GET /api/prices 200 2 - 1.652 ms

2019-11-03T23:32:35.448Z PostmanRuntime/7.19.0 GET /api/prices 500 159 - 4.255 ms

2019-11-03T23:32:36.916Z PostmanRuntime/7.19.0 GET /api/prices 500 159 - 3.318 ms
Using just the command line is difficult for analyzing your Node.js applications logs. It's better to use log management solutions to monitor, analyze, and visualize events over time.
Log management tools like Loggly make it easier to detect irregularities in your Node.js applications in production. You get an aggregated view of logs across all servers. You can then visualize and search through logs to track down issues and what caused them. This allows you to perform in-depth analyses, such as discovering which times of the day require more resources than other times, and if there are any sudden spikes in your application's traffic. Here's an example logged event from Morgan:
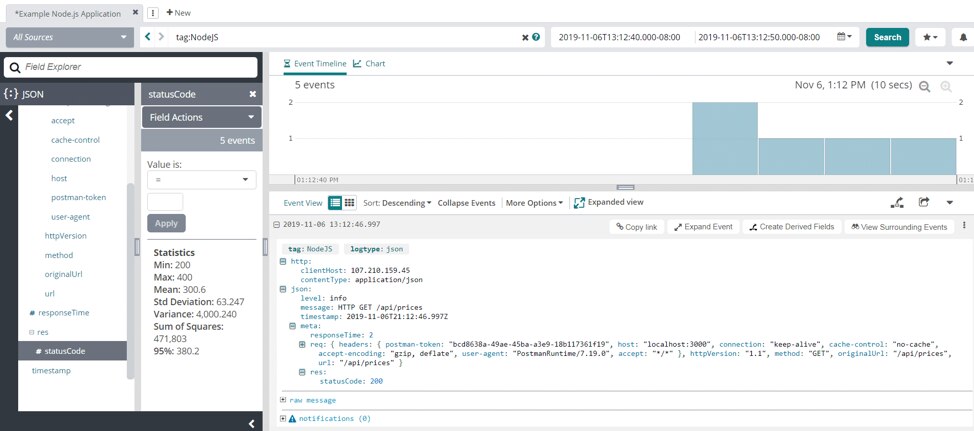
Analyzing Node.js behavior and errors with Loggly | source - loggly.com
One common issue you'll run into in production is latency with API calls. Your Node app might have high latency to a third-party API or a custom API. You can see when the latency in your requests or responses increases. This can lead you to a change made in development, an API outage, or a database connection issue.
A graph from a log management tool like Loggly can show you how long the issue has existed, when it started, and when it ended. You can filter Morgan logs by the responseTime to see which requests are taking the longest to complete.
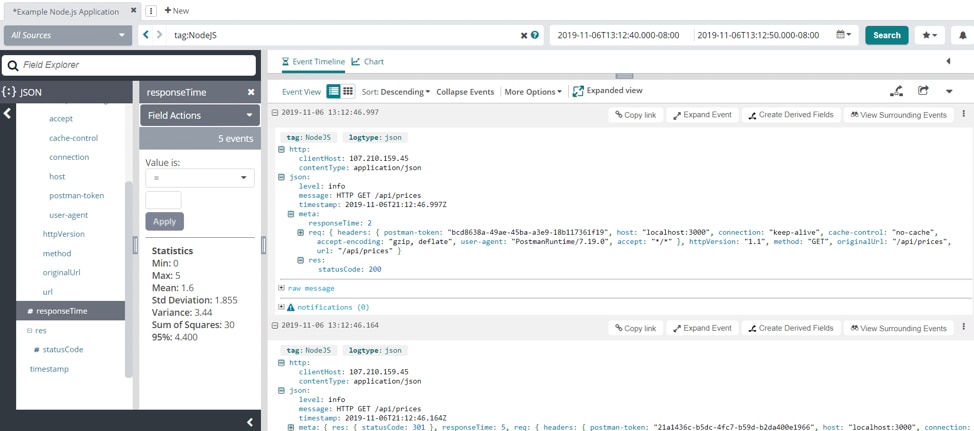
Example requests with responseTime values between 0ms and 5ms | source - loggly.com
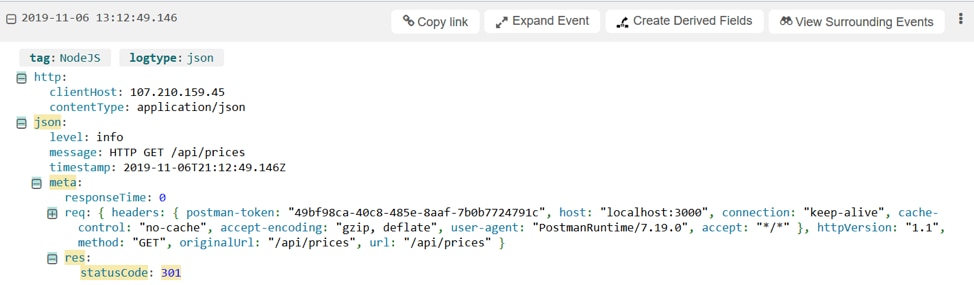
You can also see the exact logs that have an above-average response time, when the request started, and when the response was sent.

A parsed request from with a 5ms responseTime | source - loggly.com
Another metric you can get from your logs is an HTTP status code. You can see how frequently different status codes are sent and track how often errors occur. Getting the rate at which errors occur will help you find where in your application they originate from. This can also help you support customers experiencing similar issues because you can create a set of troubleshooting steps for them. You can find the status codes in your Morgan logs in the json.meta.res.statusCode field.
Discovering which errors are happening most often can help you create a priority list of issues to fix in production. As you fix the top exceptions, you might notice this resolves other exceptions. If your production environment is experiencing issues, you can check the top exceptions for each service, or you can check the top exceptions around the time issues began to occur. You'll be able to surface exceptions in the event JSON sent to Loggly from your Node application. This shape is user defined, as shown in the example below of a different event shape:
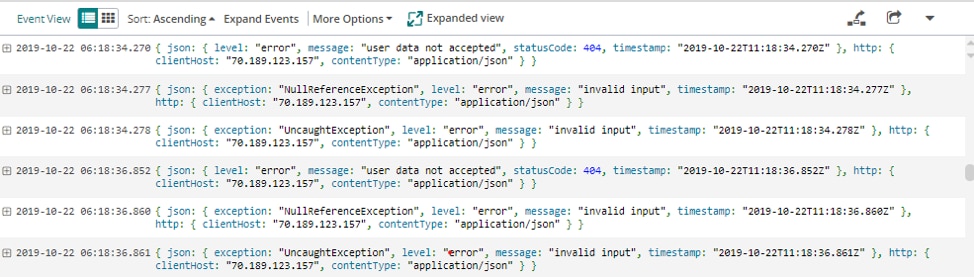
Source | loggly.com
Loggly allows you to list the top exceptions and their corresponding counts in your log management tool.
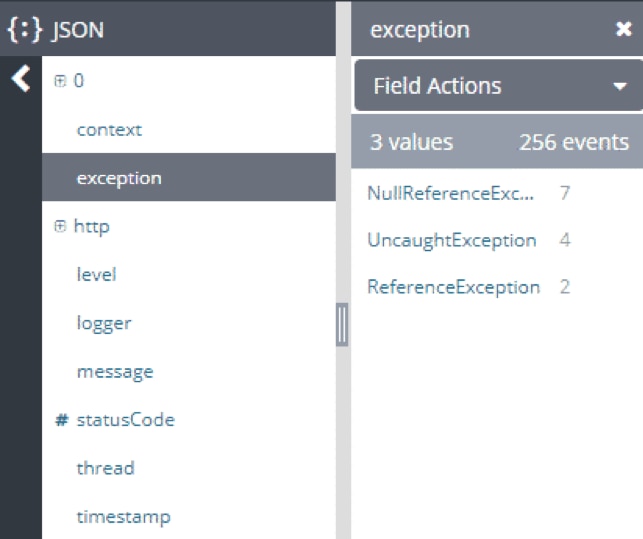
Source | loggly.com
You can also detect unusual user activity using Loggly. For example, one user might be hogging all of your server resources, affecting latency or availability for other users. Once you have identified the malicious user(s), you can block their access to your application and update your security to prevent future malicious activity attempts.
You can easily see these metrics with the charting capabilities of Loggly by filtering logged server events and drilling down into client IP or UserAgent to detect malicious or unauthorized traffic.

Source | loggly.com

Source | loggly.com
Getting the right information from your Node logs can be tricky without the right tools. By including a log management system in your logging setup, you can gather valuable insights you might have missed otherwise.
If you still experience issues after troubleshooting your Node app, check out the next section on Troubleshooting with Node Logs.