Technical Resources
Educational Resources
APM Integrated Experience
Connect with Us
Troubleshooting is one of the main reasons people create logs. When a problem occurs, you’ll want to diagnose it to understand why it happened and what the cause was. An error message or a sequence of events can give clues to the root cause, indicate how to reproduce the issue, and guide you towards solutions. This section presents scenarios where you can use Linux logs for troubleshooting.
For security purposes, you may want to know which users have logged in or attempted to log in to your system. You can check your authentication logs for failed attempts, which occur when users provide incorrect credentials or don’t have permission to log in. This often occurs when using SSH for remote access or when using the su command to run a command as another user. These types of authentication events are logged by the pluggable authentication module (PAM). Failed events often contain strings like “Failed password” and “user unknown,” while successful authentication events often contain strings like “Accepted password” and “session opened.”
Examples of failure events include:
pam_unix(sshd:auth): authentication failure; logname= uid=0 euid=0 tty=ssh ruser= rhost=10.0.2.2
Failed password for invalid user hoover from 10.0.2.2 port 4791 ssh2
pam_unix(sshd:auth): check pass; user unknown
PAM service(sshd) ignoring max retries; 6 > 3
Examples of successful logins include:
Accepted password for hoover from 10.0.2.2 port 4792 ssh2
pam_unix(sshd:session): session opened for user hoover by (uid=0)
pam_unix(sshd:session): session closed for user hoover
If we want to find out which user accounts have the most failed logins, we first need to extract the user name from the auth log. We’ll use the grep, cut, sort, and uniq commands to do this. Grep returns lines containing “invalid user,” cut extracts the usernames, sort orders the list of names, and uniq counts the number of unique names:
$ grep "invalid user" /var/log/auth.log | cut -d ' ' -f 10 | sort | uniq -c | sort -nr
169 admin
157 administrator
84 adm
73 test
67 oracle
2 nagios
2 guest
Other applications and services may use different formats, so you’ll need to adapt this command for each application. Log management systems can effectively do this for you by automatically parsing fields like username. This lets you quickly view and filter on failed logins with a single click. In this example, we can see the root user attempted to log in over 300 times.
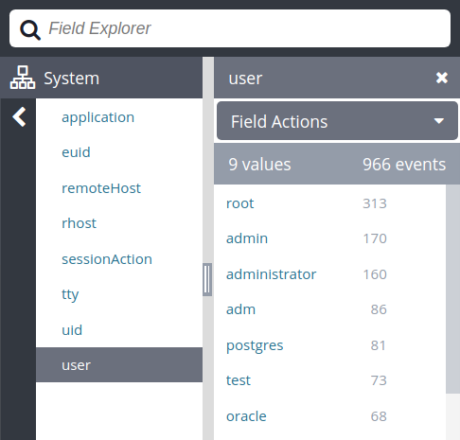
User names associated with failed login attempts shown in the Loggly® Dynamic Field Explorer.
Log management systems can also let you view graphs over time to spot unusual trends. If someone had one or two failed logins within a few minutes, it might be that a real user forgot his or her password. However, if there are hundreds of failed logins or they are all different usernames, it’s more likely someone is trying to attack the system. Here you can see a sudden surge in attempted logins as an administrator, which is often not a legitimate use of the system.
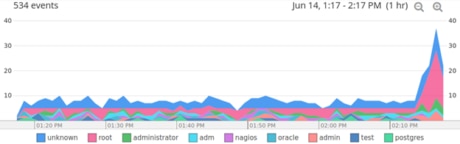
The surge in attempted root logins. © 2019 SolarWinds, Inc. All rights reserved.
Sometimes a server can stop due to a system crash or reboot. How do you know when it happened and who did it?
One of the simplest methods is to use the command last reboot to parse the /var/log/wtmp file. The output of last reboot displays logins for the “reboot” pseudo user. The “reboot” pseudo user logs in every time a system is rebooted.
$ sudo last reboot
reboot system boot 4.18.0-348.el8.0 Mon Jul 4 23:32 still running
reboot system boot 4.18.0-348.el8.0 Tue May 10 00:16 - 23:32 (55+23:15)
wtmp begins Tue May 10 00:16:25 2022
If someone ran the shutdown command manually, you can see it in the auth log file. Here you can see that someone remotely logged in as the user ubuntu and then shut the system down.
Jun 13 21:03:38 ip-172-31-34-37 sshd[1172]: pam_unix(sshd:session): session opened for user ubuntu by (uid=0)
Jun 13 21:03:38 ip-172-31-34-37 systemd: pam_unix(systemd-user:session): session opened for user ubuntu by (uid=0)
Jun 13 21:03:41 ip-172-31-34-37 sudo: ubuntu : TTY=pts/0 ; PWD=/home/ubuntu ; USER=root ; COMMAND=/sbin/shutdown -r now
If you want to see when the server restarted regardless of reason (including crashes), you can search the kernel log file(/var/log/kern.log). Syslog also applies the “kern” facility to kernel logs. The following logs were generated immediately after boot. Note the timestamp between the brackets is 0: this tracks the amount of time since the kernel started. You can also find boot logs by searching for “BOOT_IMAGE”.
Jun 13 21:04:22 ip-172-31-34-37 kernel: [ 0.000000] Linux version 4.15.0-1039-aws (buildd@lgw01-amd64-034) (gcc version 7.3.0 (Ubuntu 7.3.0-16ubuntu3)) #41-Ubuntu SMP Wed May 8 10:43:54 UTC 2019 (Ubuntu 4.15.0-1039.41-aws 4.15.18)
Jun 13 21:04:22 ip-172-31-34-37 kernel: [ 0.000000] Command line: BOOT_IMAGE=/boot/vmlinuz-4.15.0-1039-aws root=LABEL=cloudimg-rootfs ro console=tty1 console=ttyS0 nvme_core.io_timeout=4294967295
Alternatively, you can print the full contents of the kernel ring buffer with the dmesg command. Below is a truncated example of dmesg output from a Rocky Linux 8.5 system.
$ sudo dmesg
[ 0.000000] Linux version 4.18.0-348.el8.0.2.x86_64 (mockbuild@dal1-prod-builder001.bld.equ.rockylinux.org) (gcc version 8.5.0 20210514 (Red Hat 8.5.0-3) (GCC)) #1 SMP Sun Nov 14 00:51:12 UTC 2021
[ 0.000000] Command line: BOOT_IMAGE=(hd0,gpt1)/boot/vmlinuz-4.18.0-348.el8.0.2.x86_64 root=UUID=4c90d825-f649-4c1b-97b8-11f283331ef5 ro console=ttyS0,115200n8 no_timer_check net.ifnames=0 crashkernel=auto
[ 0.000000] x86/fpu: Supporting XSAVE feature 0x001: 'x87 floating point registers'
[ 0.000000] x86/fpu: Supporting XSAVE feature 0x002: 'SSE registers'
[ 0.000000] x86/fpu: Supporting XSAVE feature 0x004: 'AVX registers'
[ 0.000000] x86/fpu: xstate_offset[2]: 576, xstate_sizes[2]: 256
[ 0.000000] x86/fpu: Enabled xstate features 0x7, context size is 832 bytes, using 'standard' format.
[ 0.000000] BIOS-provided physical RAM map:
[ 0.000000] BIOS-e820: [mem 0x0000000000000000-0x000000000009fbff] usable
[ 0.000000] BIOS-e820: [mem 0x000000000009fc00-0x000000000009ffff] reserved
[ 0.000000] BIOS-e820: [mem 0x00000000000f0000-0x00000000000fffff] reserved
[ 0.000000] BIOS-e820: [mem 0x0000000000100000-0x000000003fff6fff] usable
[ 0.000000] BIOS-e820: [mem 0x000000003fff7000-0x000000003fffffff] reserved
[ 0.000000] BIOS-e820: [mem 0x00000000feffc000-0x00000000feffffff] reserved
[ 0.000000] BIOS-e820: [mem 0x00000000fffc0000-0x00000000ffffffff] reserved
[ 0.000000] NX (Execute Disable) protection: active
[ 0.000000] SMBIOS 2.4 present.
There are several reasons a server might crash, but one common cause is running out of memory.
When RAM and swap space are completely exhausted, the kernel will start killing processes—typically those using the most memory and the most short-lived. The error occurs when your system is using all its memory and a new or existing process attempts to access additional memory. Look in your log files for strings like “Out of Memory” or for kernel warnings. These strings can indicate your system intentionally killed the process or application rather than allowing the process to crash.
Examples:
Jun 13 21:30:26 ip-172-31-34-37 kernel: [ 1575.404070] Out of memory: Kill process 16471 (memkiller) score 838 or sacrifice child
Jun 13 21:30:26 ip-172-31-34-37 kernel: [ 1575.408946] Killed process 16471 (memkiller) total-vm:144200240kB, anon-rss:562316kB, file-rss:0kB, shmem-rss:0kB
Jun 13 21:30:27 ip-172-31-34-37 kernel: [ 1575.518686] oom_reaper: reaped process 16471 (memkiller), now anon-rss:0kB, file-rss:0kB, shmem-rss:0kB
You can find these logs in the kernel log (/var/log/kern.log) or in the syslog (/var/log/syslog). You can use a tool like grep to search for the relevant entries:
$ grep "Out of memory" /var/log/syslog
Jun 13 21:30:26 ip-172-31-34-37 kernel: [ 1575.404070] Out of memory: Kill process 16471 (memkiller) score 838 or sacrifice child
Keep in mind grep itself uses memory, so you might cause an out-of-memory error just by running grep. This is another reason why centralizing your logs can be beneficial!
The cron daemon is a scheduler that runs commands at specified dates and times. If the process fails to run or fails to finish, then a cron error appears in your log files. You can find these files in /var/log/cron, /var/log/messages, and /var/log/syslog depending on your distribution. There are many reasons a cron job can fail. Usually, the problems lie with the process rather than the cron daemon itself.
By default, cron jobs output to syslog and appear in the /var/log/syslog file. You can also redirect the output of your cron commands to another destination, such as standard output or another file. In this example, we pipe “Hello world” to the logger command. This creates two log events: one from cron and one from the logger command. The -t parameter sets the app name to “helloCron”:
$ crontab -e
*/5 * * * * echo 'Hello World' 2>&1 | /usr/bin/logger -t helloCron
Which creates the log entries:
Apr 28 22:20:01 ip-172-31-11-231 CRON[15296]: (ubuntu) CMD (echo 'Hello World!' 2>&1 | /usr/bin/logger -t helloCron)
Apr 28 22:20:01 ip-172-31-11-231 helloCron: Hello World!
Each cron job will log differently based on the specific type of job and how it outputs data. Hopefully, there are clues to the root cause of problems within the logs, or you can add additional logging as needed. In most cases, you should simply let cron log the output of your commands.
Last updated: 2022