Technical Resources
Educational Resources
APM Integrated Experience
Connect with Us
Systemctl is an extremely powerful Linux utility that comes with systemd. It comes with a long list of options for different functionality, the most common of which are starting, stopping, restarting, or reloading a daemon. In the following examples, we will see how we can use systemctl for some of the troubleshooting purposes.
To check which services are installed in the local Linux system, execute this command (we are assuming you are the root user).
# systemctl list-unit-files --type service
This should show a list of service units installed in the server regardless of their state (enabled, disabled, or static):
UNIT FILE            STATE

arp-ethers.service    disabled

auditd.service        enabled

autovt@.service       disabled

avahi-daemon.service   enabled

brandbot.service      static

...

console-getty.service  disabled

console-shell.service  disabled

cpupower.service      disabled

crond.service         enabled

...

firewalld.service     enabled

getty@.service        enabled

...

nginx.service         enabled

...

rsyncd.service        disabled

rsyslog.service       enabled

sshd-keygen.service   static

sshd.service          enabled

sshd@.service         static

...
Note, we’ve included only service units here. If you want to check other types of units, you can use appropriate options in the type parameter. This is a quick way to check if a particular application (e.g., MySQL) is available in the server.
Although checking installed services in a system is useful for administration purposes, we would be more interested in services that are actually running or currently active in memory. There are two ways to check this. The first method will show us which service units are currently loaded and active. The list-units parameter with systemctl is used in this case.
# systemctl list-units --type=service
The output shows services that are currently loaded and active in memory. However, some services could start and then exit after spawning another service or doing some function. They may still be active, as shown below:

Output of running systemctl list-units. © 2019 SolarWinds, Inc. All rights reserved.
In the second method, you can further fine-tune this command to list only the running services.
# systemctl list-units --type=service --state=running
The following command shows the resources a service unit will depend on or the resource units that will depend on this service in recursive manner.
# systemctl list-dependencies <service_unit_file>
Running this command against the mysqld.service shows too many dependencies to list all at once, but here’s an excerpt.

List of dependencies when running the MySQL service. © 2019 SolarWinds, Inc. All rights reserved.
To see which units failed to load or activate, run this command.
# systemctl --failed
The output may or may not show any results. But if there are units that failed to load or activate, they’ll be listed here. In the command output shown below, we can see the kdump crash recovery service failed to activate.
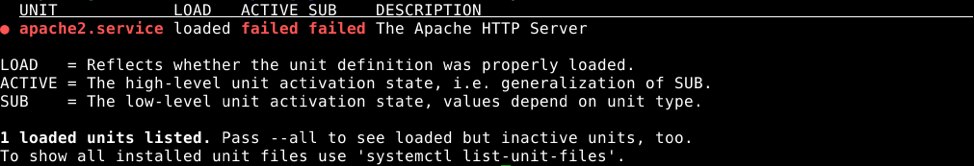
The apache2.service unit failing to start. © 2019 SolarWinds, Inc. All rights reserved.
If you suspect a particular service failed, you can use the is-failed parameter with systemctl. Taking the example of apache2.service, if we execute the following command:
# systemctl is-failed apache2.service

failed
The output is shown as failed. The same test against the crond service shows us it did not fail.
# systemctl is-failed crond.service

active
An enabled unit will automatically start on boot. To check if a service is enabled, use the following command.
# systemctl is-enabled <service_unit_file>.service
So, if we want to check if syslog service is enabled, the command is.
# systemctl is-enabled rsyslog.service
Depending on the state, the output may be enabled or disabled.
Another systemd tool called systemd-analyze can provide valuable information about total time taken by the boot process. Executing this command.
# systemd-analyze
will show an output like this:
Startup finished in 8.462s (firmware) + 6.281s (loader) + 14.170s (kernel) + 8.684s (userspace) = 37.598s
graphical.target reached after 8.679s in userspace
To see what time each service unit took to load during boot, use the systemd-analyze command with the blame option.
# systemd-analyze blame
The output will be like this.
25.265s	accounts-daemon.service
2.161s	mysql.service
1.448s	cloud-init-local.service
1.221s	systemd-udev-settle.service
1.014s	ifup-wait-all-auto.service
853ms	cloud-init.service
697ms	cloud-config.service
...
As you can imagine, this can be a valuable tool to consider if your server is taking a long time to boot and you’re not sure what the cause is. Using the output from this command you can start troubleshooting individual services that are taking too long to load. A good tutorial on systemctl can be found in DigitalOcean. Another quick reference is in techmint.