Technical Resources
Educational Resources
APM Integrated Experience
Connect with Us
When a problem occurs, logs are one of your strongest assets. They provide tons of important data, including error messages, memory dumps, and stack traces. This can help with troubleshooting by identifying what the problem is, where it occurred, and providing contextual information and traceability.
In this section, we will demonstrate how logs are useful for troubleshooting and resolving common problems in Python applications.
Users expect modern applications to be fast and reliable. Any issues affecting service quality need to be identified and addressed quickly, otherwise, users might abandon your application for a competitor’s. Resolving application problems often involves these basic steps:
Python tracebacks are messages that Python displays after a program encounters an exception. Python tracebacks begin with the text Traceback (most recent call last).
That message can be confusing to new Python programmers, but it also explains one of the key differences between Python tracebacks and stack traces in other programming languages. In Python tracebacks, the function calls that occurred most recently (the “most recent calls”) are at the bottom of the message (“last”).
Here’s a simple Python script that will create a traceback:
# Create a string and integer value

myStr = "11"

myInt = 11

# Subtract the values

print( myStr - myInt)
When we execute it, the script should return a traceback similar to:
Traceback (most recent call last):

File "/home/pepandegg/cantDoMath.py", line 4, in

print( myStr - myInt)

TypeError: unsupported operand type(s) for -: 'str' and 'int'
The last line tells us we have a TypeError (meaning: the issue is related to our data types). Specifically, we can’t perform subtraction using a string and integer. Above that, we see the call that had the exception (line 4).
With that in mind, here are some tips for reading Python tracebacks:
File "/home/pepandegg/cantDoMath.py", line 4, in <module>

print( myStr - myInt)
, which point to a specific module and line of code. In many cases, you may need to work your way through multiple call stacks to find the root cause of an issue.To demonstrate troubleshooting via logs, we’ll use MDN Local Library, a Django application that provides a book library catalog. While this is a Django application, these techniques can help you debug any Python application.
First, we configured the Django logging framework to send all logs to Syslog. We then forwarded Syslog events to SolarWinds® Loggly®, a cloud-based log management solution, so we can more easily parse and search our logs.
Exceptions occur when an application reaches an unexpected or unmanageable execution state. Exceptions can threaten the entire application’s stability, making it essential to identify and handle them as quickly as possible.
One of the easiest way to log an exception is with the logger.exception() method. Calling it from an exception handler (such as a catch block) automatically appends exception data to the message and logs it as an error.
For example, the local library app tracks several fields for each book, including the title, author, and genre. Let’s say we want to add a new field called “publication_year.” We’ll add the year to the Book model in the file /catalog/models.py, then add HTML to render the field in /catalog/templates/catalog/book_detail.html. However, when we restart the app and load the book catalog, we see a generic error page showing “Server Error (500).” What happened?
First, let’s search for logs where the server response has an HTTP status code of 500. We can do this in Loggly by searching “json.status_code:500.” This gives us two recent log events: one for the request and one for the server.
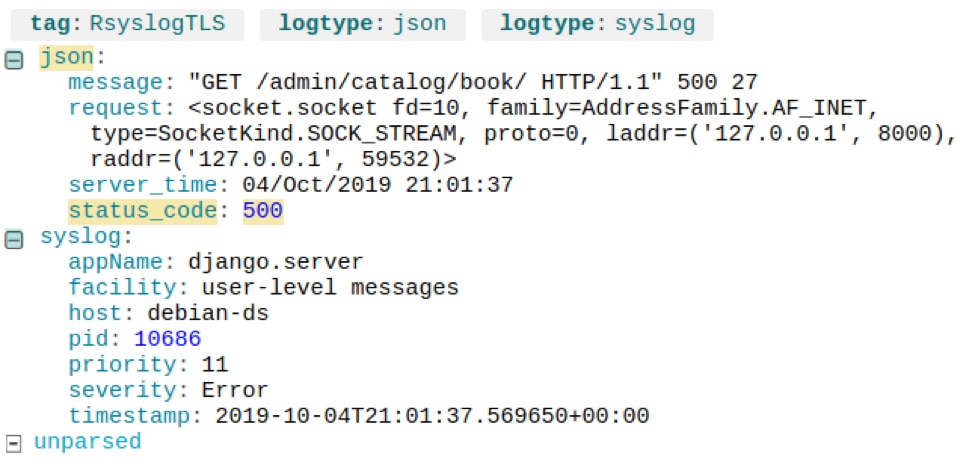
A Django request log resulting in an HTTP 500 Internal Server Error. © 2019 SolarWinds, Inc. All rights reserved.
The server response includes a traceback in the json.exc_info field, which gives us the exact cause of the error:
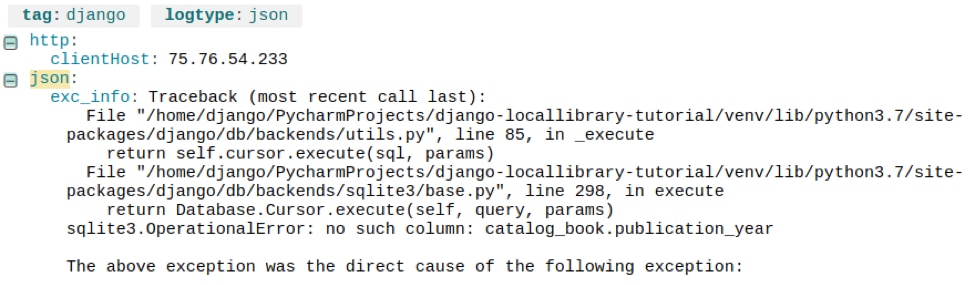
A Django server log showing the cause of an internal server error. © 2019 SolarWinds, Inc. All rights reserved.
sqlite3.OperationalError: no such column: catalog_book.publication_year shows that the cause was the SQLite backend not finding the publication_year column in the database. In other words, we forgot to migrate our database before restarting Django. We can fix this issue with the following commands:
$ python manage.py makemigrations

Migrations for 'catalog':

catalog/migrations/0023_book_publication_year.py

•Add field publication_year to book

$ python manage.py migrate

Operations to perform:

Apply all migrations: admin, auth, catalog, contenttypes, sessions

Running migrations:

Applying catalog.0023_book_publication_year... OK
Web application frameworks like Django process requests by mapping URLs to Python functions. This is known as a URLconf (URL configuration). Django uses the URL’s components when a request comes in to determine which method to run. For example, if a user opens http://localhost:8000/catalog/books, Django calls the BookListView.as_view() method, which renders a list of books as HTML.
However, routes sometimes fail or don’t work as expected. When this happens, logs can tell you exactly what URL the user was requesting and why Django failed to properly route it.
For example, let’s say a recent code change causes all user logins to return a 404 error. Searching for logs with “json.status_code:404” shows several results similar to the following:
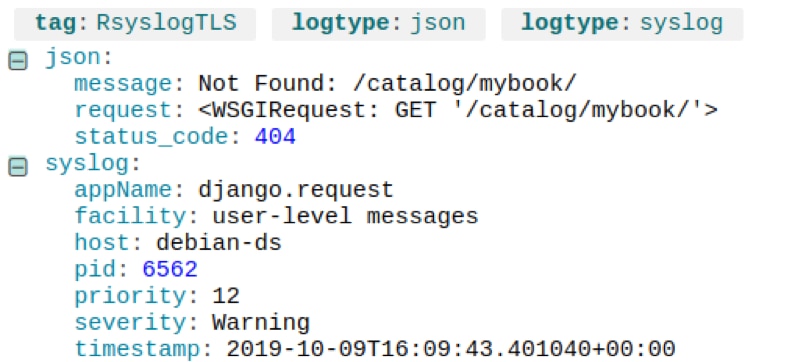
A 404 error due to an invalid URL. © 2019 SolarWinds, Inc. All rights reserved.
The /catalog/mybook/URL doesn’t exist, but why are users requesting it? Maybe there’s a bad link somewhere in the application. If we look at the event immediately preceding it, we see the user sent a POST to the login page, which affirms they came from the login page:
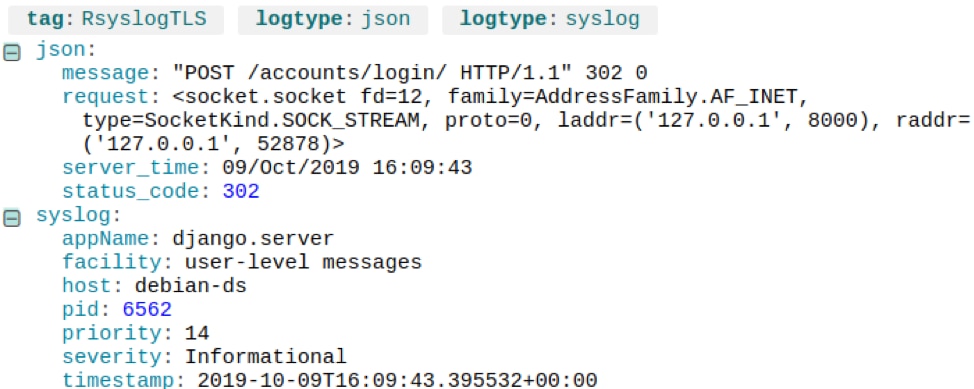
A form submission (POST) resulting in a 404 error. © 2019 SolarWinds, Inc. All rights reserved.
It turns out a typo in the login page is failing to redirect to their checked-out books when they log in. If we change the route to /catalog/mybooks/, the 404 errors disappear.
Some problems require more interactive forms of debugging. There are several tools you can use to debug Python applications, even ones running in production.
The Python debugger—also called PDB—is a source code debugger that can step through code, set breakpoints, inspect stack frames, and inject arbitrary code during execution. It also supports post-mortem debugging (inspecting a program’s state after an unexpected exit).
You can invoke PDB from a Python application using the breakpoint() method. Alternatively, you can start PDB from the command line by running python -m pdb <application name>.py.
One risk of using PDB in production, calling the debugger will pause your program’s execution. This can cause requests to time out and fail, especially if you’re stepping through code. You can use PDB to build and test your application, then disable the breakpoint() calls in production by setting the PYTHONBREAKPOINT environment variable to 0.
Where PDB requires you to modify or re-run your application, dynamic tracing tools can observe running applications without having to change or restart them. A well-known tool is DTrace, which can extract information from processes such as memory usage, function calls, and garbage collection processes. As an example, you can use Dtrace to measure the latency of function calls in Python.
To learn more, visit the Python how-to page on instrumenting CPython with DTrace and SystemTap.
Last updated: 2022