Technical Resources
Educational Resources
APM Integrated Experience
Connect with Us
.NET logs allow you to monitor and troubleshoot events in your applications and in the .NET runtime. Logs can provide important troubleshooting information if your application is slow, displaying errors, or crashing. The challenge is .NET applications of the smallest size can generate thousands of events spread out over multiple files. Trying to find the root cause of a problem by manually reading through logs would be like trying to find a needle in numerous ever-growing haystacks.
In this section, we’ll cover several different methods of searching through .NET application logs. We’ll show you how to use tools built into Windows and third-party solutions.
Windows® includes several tools for collecting and searching logs. We’ll focus on two in particular: the Windows Event Viewer® and PowerShell®. If you want to learn more about logging in Windows, visit the Windows section of the Ultimate Guide to Logging.
The Windows Event Viewer is a graphical interface to the Windows event log, which consolidates logs from applications, processes, and services running on Windows hosts. Event Viewer lets you view, filter, analyze, and export logs from almost any software component running on the system. If your application logs to the event log (for example, using Log4Net’s EventLogAppender®), Event Viewer is a useful tool for viewing these logs.
The following screenshots show Windows Server 2019, but these instructions apply to any Windows version later than Server 2012. To open Event Viewer, open the Start menu, expand Windows Administrative Tools, and click Event Viewer.
On startup, Event Viewer displays an overview of events, including the total number of events, events grouped by severity, recently viewed events, and a summary of events by category.
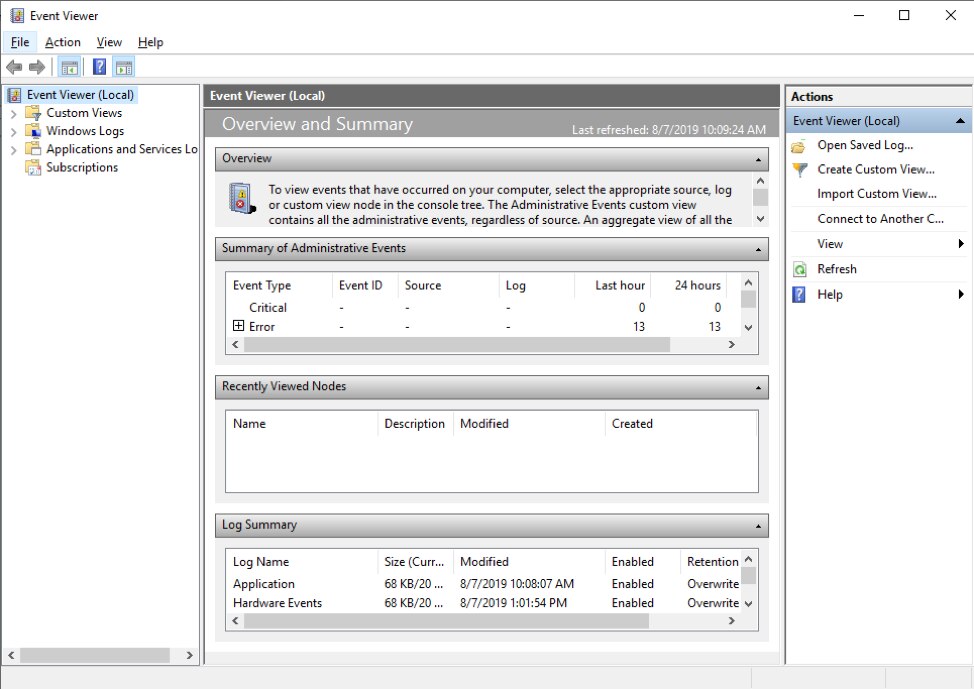
The Windows Event Viewer startup screen. © 2019 Microsoft Corporation. All rights reserved.
To view logs generated by applications, expand Windows Logs and click Application in the left-hand sidebar. The Source column shows the name of the application that logged the event.
To filter the view, click Filter Current Log in the Actions sidebar on the right-hand side of the screen. This opens a dialog where you can apply filters, such as a specific date range, application, level, or user running the application. You can also filter events by searching the message field for keywords. If you’re using Event Viewer to access event logs on other computers, you can even filter by computer.
For example, we have an ASP.NET application named “MVC5App” for which we want to search logs. Here, we filter the event log to show important events reported by our application in the last hour.
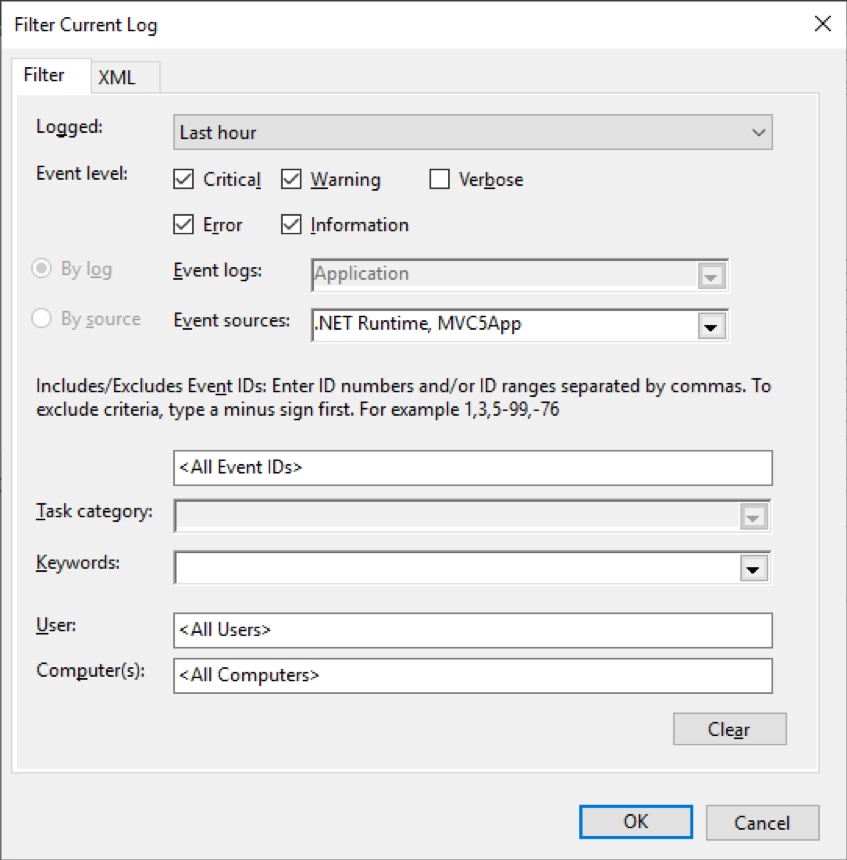
Filtering the Windows Application log to a specific application, date range, and severity. © 2019 Microsoft Corporation. All rights reserved.
The Windows event log stores logs and their metadata as XML documents. As a result, queries created in the filter dialog are converted to XPath, a language used to traverse and search an XML document. You can click on the XML tab to view the XPath used in your query and create your own custom query. You can even perform advanced functions such as adding multiple additional queries.
For example, here is the XML for the query shown in the above screenshot. You can see the XPath query in the <Select> node.
<QueryList>
<Query Id="0" Path="Application">
<Select Path="Application">*[System[Provider[@Name='.NET Runtime' or @Name='MVC5App'] and (Level=1 or Level=2 or Level=3 or Level=4 or Level=0) and TimeCreated[timediff(@SystemTime) <= 3600000]]]</Select>
</Query>
</QueryList>
To learn more about XML queries and XPaths, visit Microsoft’s Directory Services Team blog.
PowerShell is one of the most useful tools for searching through log files on Windows. It provides specific functions for reading and parsing log files and is available for any version of Windows. In addition, it can easily pipe a parsed log entry to other programs or functions for further processing.
For example, imagine our ASP.NET application logs to a JSON file using the log4net.Ext.Json library. With PowerShell, we can easily parse the contents of the file and assign it to a variable called $events:
$events = Get-Content .\log-json.txt | ConvertFrom-Json
> $events
date : 2019-08-08T15:11:33.0430243-04:00
level : INFO
appname : /LM/W3SVC/2/ROOT-1-132097650872106588
logger : MVC5App.Controllers.HomeController
thread : 8
ndc : (null)
message : Loading home page.
PowerShell automatically stores each JSON attribute in a separate field. If we want to find all debug logs, we can do so by piping the event to the Where-Object cmdlet and searching on the level field:
$events | Where-Object {$_.level -eq 'DEBUG'}
date : 2019-08-08T15:12:00.4180115-04:00
level : DEBUG
appname : /LM/W3SVC/2/ROOT-1-132097650872106588
logger : MVC5App.Controllers.AccountController
thread : 8
ndc : (null)
message : Loading login page.
PowerShell can also access the Windows event log using the Get-EventLog cmdlet. Like Event Viewer, Get-EventLog can display an overall summary of events, access individual events, search events by field or XPath, and fetch events from other computers.
For example, our application provides an authentication form and logs all attempted logins. Any failed logins are given a severity of Warning. We’ll search for warning-level logs containing the word “login”, then pipe the output to Select-Object for easier readability.
Get-EventLog -LogName Application -Source MVC5App -EntryType Warning -Message *login* | Select-Object -Property *
EventID : 0
MachineName : SERVER2019
Data : {}
Index : 2747
Category : (0)
CategoryNumber : 0
EntryType : Warning
Message : 2019-08-08 15:12:13,764 [8] WARN MVC5App.Controllers.AccountController [(null)] - Attempting login with email admin@example.com
Source : MVC5App
ReplacementStrings : {2019-08-08 15:12:13,764 [8] WARN MVC5App.Controllers.AccountController [(null)] - Attempting login with email admin@example.com}
InstanceId : 0
TimeGenerated : 8/8/2019 3:12:13 PM
TimeWritten : 8/8/2019 3:12:13 PM
UserName :
Site :
Container :
Here, we see a user tried to log in as an administrator, which could indicate a potential security breach. We should continue monitoring the event log for further attempts.
Event Viewer and PowerShell are useful for searching logs on a single host, but they’re hard to scale to multiple hosts. Centralized log management and monitoring services are designed to collect and aggregate logs from multiple different hosts, making them much more effective for large-scale deployments and cloud computing workloads.
In this section, we’ll present two different types of log centralization services: cloud platform monitoring solutions and complete log management solutions.
Cloud computing platforms such as Azure®, AWS®, and Google Cloud® offer services designed to monitor and collect logs from .NET applications automatically. For example, Azure has Azure Monitor®, which collects Windows and .NET logs via the Azure Diagnostics Extension® and Application Insights®. GGoogle Cloud operations suite® also provides .NET logging via an instrumentation library.
These solutions are convenient and well-integrated into the cloud platform, but they’re often limited in features. For example, Amazon CloudWatch Logs® can parse fields from logs, but only from AWS service logs and JSON logs. This can be a problem if your application logs are stored in XML, plain text, or any other format.
Log management solutions like SolarWinds® Loggly® allow you to collect, aggregate, search, and analyze logs from multiple hosts in a centralized location. These solutions can ingest and parse .NET application logs regardless of format or where your application is hosted.
Using a dedicated log management solution can make searching through .NET logs much easier and faster than using Event Viewer, PowerShell, or even the cloud platform provider’s monitoring solution. This is because a dedicated solution will offer richer tools for analyzing and troubleshooting .NET logs.
For example, we can send logs from an ASP.NET application to Loggly using the lognet-loggly library, which formats events using JSON. The following screenshot shows a login attempt similar to the one we encountered using PowerShell. Loggly also shows several additional fields, such as the IP address of the user initiating the request and the name of the process, logger, and thread that generated the event.
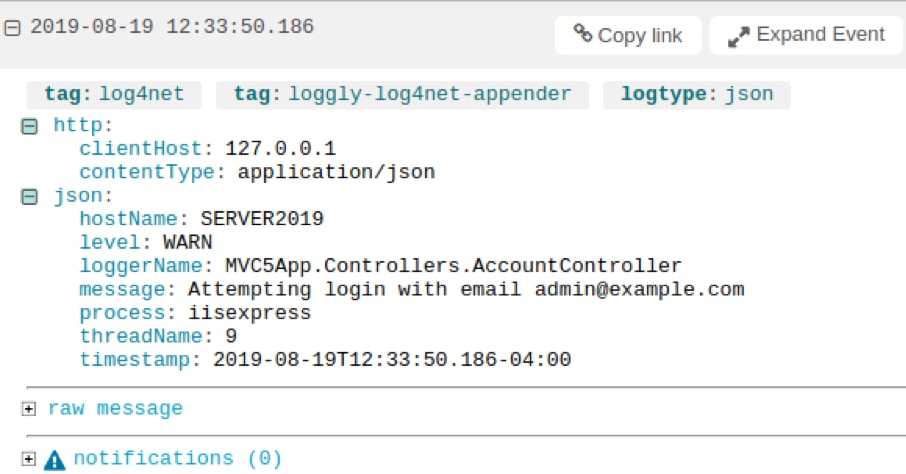
Viewing a login attempt event in SolarWinds Loggly. © 2019 SolarWinds, Inc. All rights reserved.
We can also use Loggly to search on fields. To replicate our search for failed login attempts, we can enter the following query in the search box in Loggly.
json.loggerName:"MVC5App*" json.level:"WARN" json.message:"*login*"
Not only is this query more concise than PowerShell, but it returns results from all instances of the application, even those running on separate hosts. Suppose you notice an unusual event and are logging both your application and the .NET runtime. In this case, you can use the surround search feature in Loggly to view logs immediately preceding or following the event. This can give you additional insights into what the user was doing leading up to the event or what impact the event had on your application’s performance.
Lastly, we can use a solution like Loggly to chart errors over time. This allows us to quickly identify recent errors and drill down into the logs containing the error message.
Here, we have a stacked column chart split by the json.level field. We can immediately see an error occurred around 9:48 a.m. (a failed registration attempt), surrounded by several warning messages (failed login attempts).
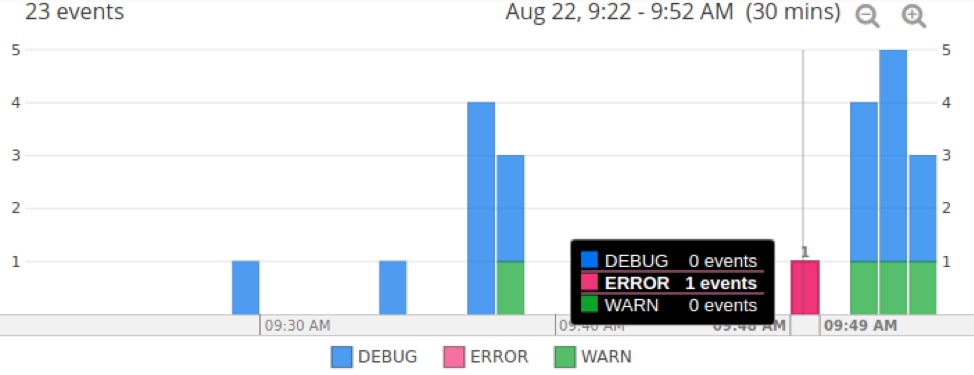
Charting by log level in SolarWinds Loggly. © 2019 SolarWinds, Inc. All rights reserved.
Next, learn more about how a log management solution can be helpful in analyzing and troubleshooting .NET logs.
Last updated: 2022