Technical Resources
Educational Resources
APM Integrated Experience
Connect with Us
Logging is essential to a software development project, but it’s often disregarded until the program crashes. Logging serves numerous purposes, including root cause and bug analysis, as well as performance reviews for the application.
With Microsoft .NET, a developer can write logs to several locations besides a flat file. The C# and VB.NET languages offer internal libraries to help get started. While they’re limited, you can find several free, easy-to-use frameworks with some extended capabilities, which we’ll discuss a few of them here. .NET has a pluggable logging architecture using ILoggerProvider to control where the log messages are written. The first-party log providers included with the .NET framework are:
If you don’t write logs in your application, Windows will still detect a crash and write messages to the Windows Event Log, which can be read using the Event Viewer application. For this reason, you might ask yourself: Why bother with logging? However, logging serves several valuable purposes.
First, you can customize the error messages you store, making it much easier to identify bugs in your application. This might not seem necessary if you’re creating small applications but think of a multi-layered application with several developers working on it. You might need to identify an error from a piece of code you didn’t write. Instead of spending hours stepping through code with different input scenarios, the right logging can point to the exact piece of code and the input causing the problem.
Look at this error logged to the Windows Event Log in Event Viewer:
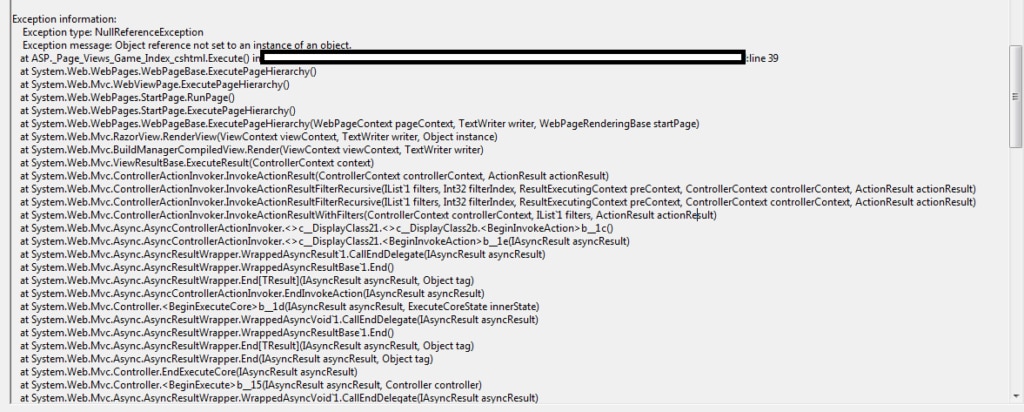
The fourth line shows the location and line of code causing the error. With this, we now know the module, project, method, and page causing the issue. What we don’t know is what caused the error. If we had a custom error logged to the Windows Event Log, we could include the user’s input and any parameters possibly causing the error.
Before getting started, remember—logging requires server resources. Most .NET programs write logs to a database or Windows Event Log if running in Windows and to the /var/log folder if running in Linux. There are security issues with flat files, but their use is also common. You’ll need extra storage space for logging, regardless of the method used.
Before you begin logging understand .NET has six main logging levels:
For our examples, we’ll use an ASP.NET Core web app in C#. We named the solution Loggly®Guide. This will be important when you need to look up errors in Event Viewer and other logging utilities.
Execute the following command in the command shell to create a new web app project:
dotnet new webapp -o LogglyGuide
If you’re developing the application on Mac or Windows, execute the following command to trust the HTTPS development certificates:
dotnet dev-certs https --trust
You can run the application anytime by navigating to the application directory and executing the dotnet run or dotnet watch command.
Let’s start by discussing the built-in logging providers in .NET. Note the first statement of the program, which creates an instance of the WebApplicationBuilder class with preconfigured defaults as follows:
var builder = WebApplication.CreateBuilder(args);
In addition to several services, the host builder adds the following logging providers to the application (see HostingHostBuilderExtensions):
Let’s write a custom log and watch it get processed by the various providers. Navigate to the IndexModel class in Index.cshtml.cs file. This is the code behind the Index page of the application. Use the ILogger instance to log a piece of information as follows:
public class IndexModel : PageModel
{
private readonly ILogger<IndexModel> _logger;
public IndexModel(ILogger<IndexModel> logger)
{
_logger = logger;
}
public void OnGet()
{
_logger.LogInformation( "Welcome to the Loggly Guide");
}
}
If running this application on Windows, you won’t see any information captured in the Windows EventLog because the EventLog only reports events higher than LogLevel.Warning. To change this behavior, update the value of the Logging property in appsettings as follows:
{
“Logging”: {
"LogLevel": {
"Default": "Information",
"Microsoft.AspNetCore": "Warning"
},
"EventLog": {
"LogLevel": {
"Default": "Information"
}
}
},
"AllowedHosts": "*"
}
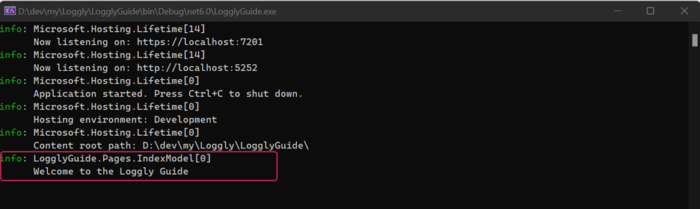
Launch the application by pressing F5 or with the command dotnet run. After navigating to the Index page, you’ll find the log statement printed on the console as follows:
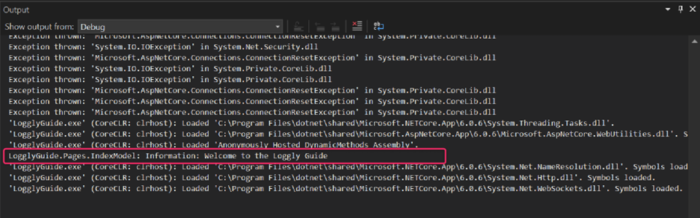
You can view the message logged to the Visual Studio output window as well:
Finally, you can launch Event Viewer and find the log:
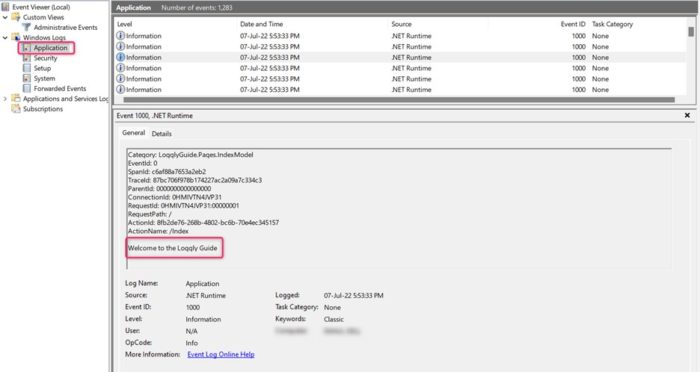
You can customize any aspect of the log written to Windows Event Log, such as the name of the application and the source of the log (displayed as .NET Runtime by default). You do this by using the appropriate overload of the AddEventLog function as follows:
var builder = WebApplication.CreateBuilder();
builder.Logging.AddEventLog(eventLogSettings =>
{
eventLogSettings.SourceName = "LogglyGuide";
});
Let’s cover the ASP.NET Core logging framework constructs:
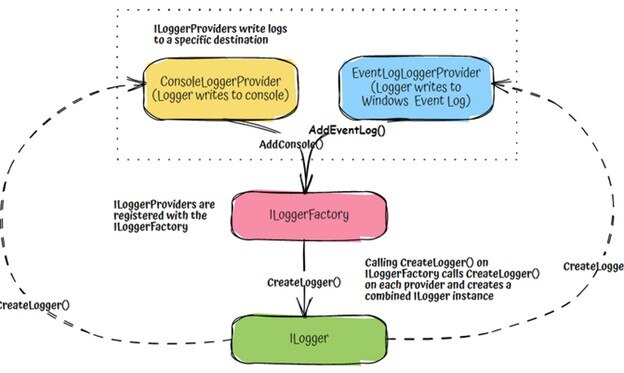
ILogger: This interface provides the Log() method, which can be used to write a log message.ILoggerProvider: Logging providers implement this interface to write the logs to a specific destination. For example, the Console ILoggerProvider writes the logs to the console. This interface is used to create a custom instance of an ILogger.ILoggerFactory: This interface registers one or more ILoggerProvider instances and provides the CreateLogger() method used to create an instance of ILogger. The factory enables a one-to-many association between the ILogger and the ILoggerProvider instances. When calling the Log() method, the log is written to every registered provider.The following diagram illustrates the components involved in configuring the ILogger:
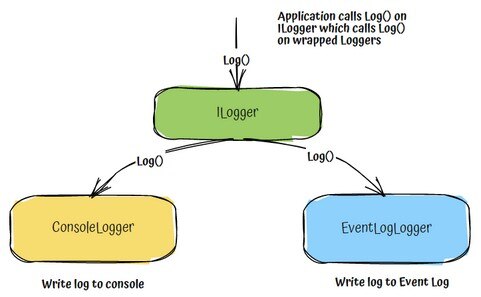
The following diagram illustrates the components involved in ILogger usage:
Let’s update our application to use only the ConsoleLoggerProvider. Update the code in the Program.cs file to clear all the logging providers and then add the ConsoleLoggerProvider as follows:
var builder = WebApplication.CreateBuilder(args);
builder.Host.ConfigureLogging(logging =>
{
logging.ClearProviders();
logging.AddConsole();
}
);
The configuration connects the ConsoleLoggerProvider (an ILoggerProvider) to the ILoggerFactory. You can now use an instance of ILogger to write logs using the registered providers.
Logging in ASP.NET Core is available through the built-in Dependency Inversion (DI). If you inspect the ConfigureLogging method, it calls AddLogging, which registers a generic ILogger in the DI container as follows:
public static IServiceCollection AddLogging(this IServiceCollection services, Action<ILoggingBuilder> configure)
{
// code omitted for brevity
services.TryAdd(ServiceDescriptor.Singleton<ILoggerFactory, LoggerFactory>());
services.TryAdd(ServiceDescriptor.Singleton(typeof(ILogger<>), typeof(Logger<>)));
return services;
}
Let’s inject an ILogger instance to the IndexModel of the Index.cshtml Razor page of our application and write a custom log message:
public class IndexModel : PageModel
{
private readonly ILogger<IndexModel> _logger;
public IndexModel(ILogger<IndexModel> logger)
{
_logger = logger;
}
public void OnGet()
{
_logger.LogInformation( "This is a custom message from the Loggly Guide");
}
}
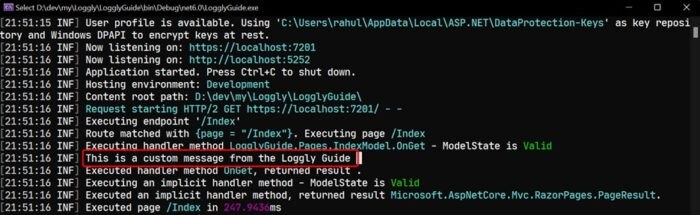
Launch the application and inspect the log statement printed to the console as follows:
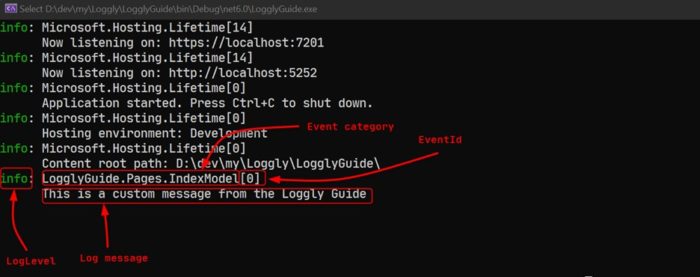
Note the presentation of the log message will vary based on the log provider. Apart from the elements shown in the log record, if you provide an Exception object to the logging function, it will log the exception in addition to the message.
Apart from the LogInformation method, ILogger defines the LogWarning and LogError extension methods, which apply the correct log level to the log message.
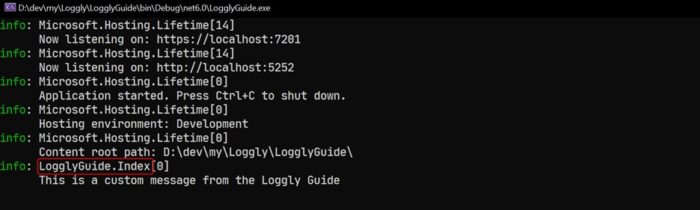
Let’s discuss the ‘event category’ element of the log in more detail. The event category specifies the component creating the log. When you use the ILogger<T> instance to write a log, the category is set to the fully qualified name of the type T using the ILogger. To change the category, you can inject ILoggerFactory instead and specify the category yourself as follows:
public class IndexModel : PageModel
{
private readonly ILogger _logger;
public IndexModel(ILoggerFactory loggerFactory)
{
_logger = loggerFactory.CreateLogger("LogglyGuide.Index");
}
public void OnGet()
{
_logger.LogInformation(“This is a custom message from the Loggly Guide”);
}
}
The following is the updated output of the program:
In the previous section, we used the ConsoleLogProvider, which writes the logs to the terminal window (or debug output window if you’re using Visual Studio and IIS Express). Third-party log providers can write the logs to various destinations. Some of the more popular third-party logging providers are:
Adding a third-party logging framework is similar to how we used one of the built-in providers:
ILoggerFactory extension method provided by the logging framework.Let’s use the NetEscapades.Extensions.Logging provider to write our application’s logs to a file.
Use the Visual Studio NuGet package manager or the .NET CLI to install the NuGet package:
dotnet add package NetEscapades.Extensions.Logging.RollingFile
Edit the Program.cs file and set up the ConfigureLogging method as follows:
builder.Host.ConfigureLogging(logging =>
{
logging.ClearProviders();
logging.AddFile();
}
);
Relaunch the application and generate logs. Since we have only attached the file logging provider to the ILoggerFactory, the logs will only be written to a file by the provider, which can be found in the Logs subdirectory of the application as follows:
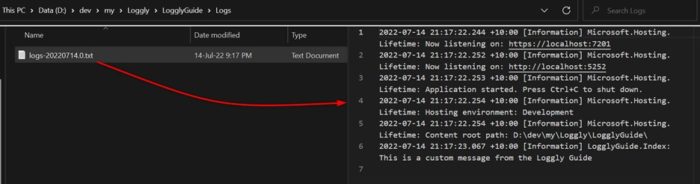
Writing logs to a persistent medium such as files is better than writing logs to an ephemeral medium such as Console in production. However, files are unsuitable for search and query operations, so they should be avoided. Persisting logs on the application server can reduce available server resources and may require troubleshooting issues such as the locking of files and read-write permissions.
It's often better to store your logs in a centralized location separate from the application. A central location will also help aggregate logs from multiple instances of your application, making the log-finding process much more straightforward.
Serilog is an open-source library like the IloggerFactory and can write logs to many different destinations such as files, a console, an Elasticsearch cluster, and so on. Since Serilog is a mature library, you’ll find you can write logs to more destinations than with the default ILoggerFactory.
Serilog provides several capabilities missing from the default logging framework. One such feature is the ability to add enrichers to automatically add information to all your log messages—such as server name and request id—which can be helpful when diagnosing issues. Please refer to the project wiki to understand the features provided by Serilog in detail.
Let’s install Serilog to our application and use the Serilog Console sink to write logs to the console. Install the following NuGet packages to your project:
dotnet add package Serilog.AspNetCore
dotnet add package Serilog.Sinks.Console
Next, set up the IHostBuilder to use Serilog for logging as follows:
using Serilog;
var builder = WebApplication.CreateBuilder(args);
builder.Host.UseSerilog((context, configuration) =>
configuration.WriteTo.Console());
When you run the application this time, you’ll find the ILogger writes output to the Console (the sink we configured). Notice the logs are more colorized than the built-in console provider, making it easier to parse the logs visually.
Let’s update the code of the OnGet method of the IndexModel class to log an error as follows:
public void OnGet()
{
//_logger.LogInformation("This is a custom message from the Loggly Guide");
_logger.LogError(new Exception("Error"), "Dummy error from the Loggly Guide");
}
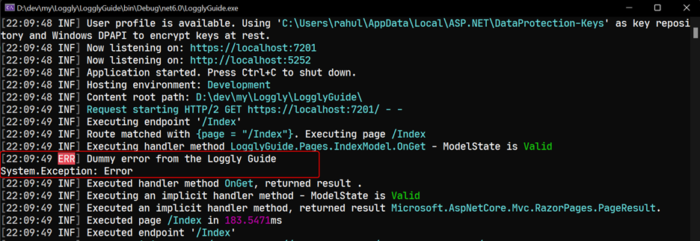
If you run the application again, you’ll see Serilog logs the custom message and the exception as follows:
We showed how to log errors, but you would only use this code for informational purposes if no error is triggered. In the previous section, we logged an event to the logging provider regardless of an error. This is useful when you want to log information such as the time an application started. Most logging, however, occurs when there are errors. This is called “error trapping,” and it’s done with a try-catch block within your .NET application.
An error in .NET is referred to as an “exception,” and they’re found in the “System.SystemException” library. Below are some of the exception classes in this library:
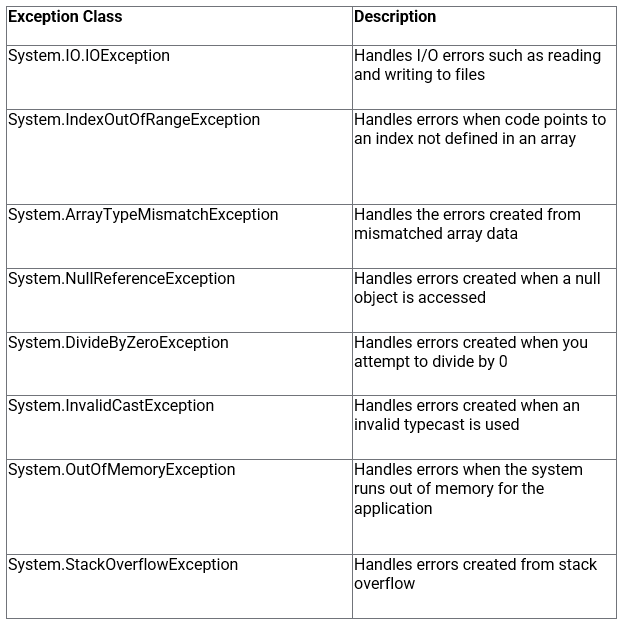
The type of error thrown depends on the compiler. You can’t control when the error is thrown if you don’t know you have a bug. With a try-catch statement, you “catch” these errors and gracefully exit the program or stop execution. With logging, you then take a snapshot of the error and keep a log for further review. Error trapping not only helps find root cause issues with your program but can also display a custom error to the user.
Look at the following code:
decimal result = 0;
int num1 = 1;
int num2 = 0;
try
{
result = num1 / num2;
}
catch (DivideByZeroException e)
{
_logger.LogError(e.Message);
}
We’ve set up num1 and num2, and then we divide them. Unfortunately, we set num2 equal to 0, so the division will cause a DivideByZeroException error.
We use a try-catch to handle these errors to prevent the application from failing. We’ve used the logging code from the previous section and placed it in the catch section.
You can browse through the code to see the try-catch in action, but we’ll explain it briefly here. Anything in the try section will run. Should any of your statements cause an error, code execution jumps directly to the catch section. Since we define the DivideByZeroException, the code jumps to this catch section. If you suspect there could be other types of exceptions, you must have multiple catch statements.
Within the catch statement, we define our logging procedure and write the error to the logging provider. Copy and paste this code to the IndexModel:
public class IndexModel : PageModel
{
private readonly ILogger _logger;
public IndexModel(ILogger<IndexModel> logger)
{
_logger = logger;
}
public void OnGet()
{
decimal result = 0;
int num1 = 1;
int num2 = 0;
try
{
result = num1 / num2;
}
catch (DivideByZeroException e)
{
_logger.LogError(e.Message);
}
}
}
You’ll find the following log written to the console when you run the application:
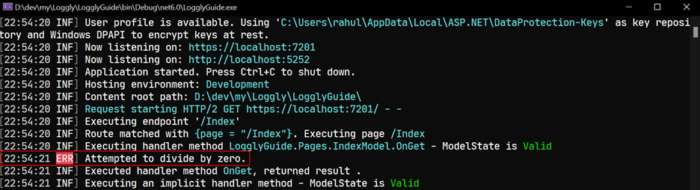
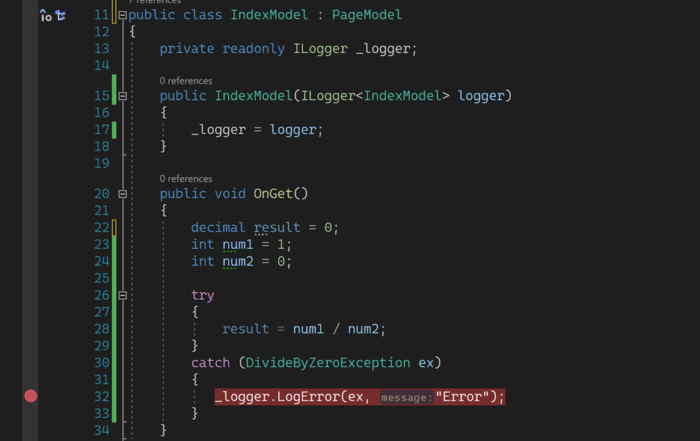
The e.Message property is written to the log message, but you can log any error and message you want in this section. In some cases, you may want to dump the entire error message into the log. Let’s update the code in the `OnGet` method to log the exception object as follows:
public void OnGet()
{
decimal result = 0;
int num1 = 1;
int num2 = 0;
try
{
result = num1 / num2;
}
catch (DivideByZeroException ex)
{
_logger.LogError(ex, "Error");
}
}
Here are the results on the console:
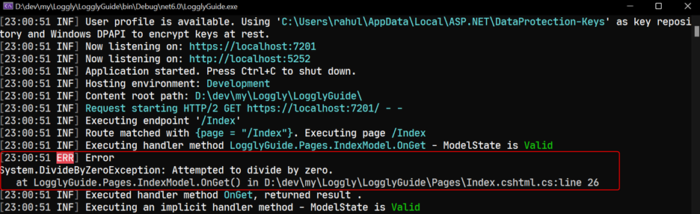
With the entire exception logged, we can see exactly where the error occurred, including the class and the line number.
You aren’t limited to logging with only the console, although it’s probably the easiest to set up and use. Some companies prefer third-party custom libraries to write logs to a file or send them to a central log aggregation server. This is beneficial for internal applications where the server is behind a firewall. You wouldn’t want hackers to gain access to error logs—if you do use flat file logs on public-facing servers, do so with a high sense of security. We’ve previously seen examples of integrating third-party log providers to .NET applications.
You should always log errors whether you use a third-party logging system or the built-in logging providers. Picture a multi-layer application spanning several departments. It could take weeks to determine the root cause if you can’t trap the errors and log them to a location. With this type of logging, you can provide detailed errors for easier troubleshooting and debugging.
Aggregated logging is a huge benefit to larger enterprises. Imagine having five web servers behind a load balancer. To identify issues with any one server, you must log into each machine individually to review logs on each machine, match up the errors, and then take the correct server out of rotation. And then trace requests across these multiple servers to identify which one is causing issues with your application.
With aggregate logging, there’s a snapshot of every server and its logs in one location. Instead of switching connections across multiple servers, you have the advantage of reading log entries in one place, speeding up root cause analysis, and reducing server downtime.
Error trapping alone isn’t enough to know if your logs are working. This is one of the more dangerous things to happen when releasing software. Most users won’t report issues if they have other options. They’ll merely choose to use a competitor’s product. It could be weeks before realizing your logs aren’t working. If the software crashes, you won’t be able to troubleshoot or find the root cause using your logging code.
You also must monitor logs to take preemptive steps to avoid more critical issues. Simply logging entries and using them for root cause analysis isn’t fully taking advantage of what logging can do. Watching logs and checking for errors can give insight into an issue progressively worsening. For instance, you might have a malformed SQL query running too slowly or causing memory leaks. Logs can detect SQL errors, potentially causing data corruption on your server. If you let these queries run for too long, they could cause significant data issues with other internal applications. When monitoring the logs, you can find these issues and repair them before they become critical.
Fortunately, in .NET, you can use the debugging tool included with Visual Studio to throw errors and ensure error trapping is working. This is especially useful when you have predefined exception types and don’t catch them all.
To step through your logging code, set a breakpoint by clicking the left side of the Visual Studio IDE next to the line of code that starts the error trapping and logging.
Now, run your code. The compiler stops at the catch statement when an error is found. To step through your code, press the F10 key. Each time you press the F10 key, another line of code executes.
In the example code, you can step through logging the error.
Last updated: 2022