Technical Resources
Educational Resources
APM Integrated Experience
Connect with Us
One of the most obvious ways to inspect how your software’s running is to execute it and watch how it runs. This is fine when your application works as expected. During development, however, this is rarely the case, especially in your local development environment.
For deeper inspection, log collection is often the first step. Good log messages allow you to go back in time when your code isn’t behaving as expected. The second step is looking through your logs to find the information needed.
The main idea behind logging is to include as much data as possible without going overboard. Typically, more debug and informational logs are collected from code during active development than from code being deployed to production. Either way, you may have to trace a certain URL giving you trouble or perhaps a chain of requests involved in a user workflow. Adding the following to your logging setup is completely optional, but it’s super helpful to include some things by default to help your search. Including the request URL and session ID are a great start.
Here are some snippets to help you do this with Laravel and Monolog.
First, we need to create a processor class to help us process log entries:
<?php
// File: app/Helpers/LogProcessor.php
namespace App\Helpers;
use Monolog\Logger;
class LogHelper {
/**
•@param Logger $logger
*/
public function __invoke($logger) {
foreach ($logger->getHandlers() as $handler) {
$handler->pushProcessor(new LogProcessor());
}
}
}
Next, we need a helper class to tie our Monolog processor into our Laravel config:
<?php
// File: app/Helpers/LogHelper.php
namespace App\Helpers;
use Illuminate\Support\Facades\Request;
use Illuminate\Support\Facades\Session;
/**
* Adds the request URL and session ID to the context of Monolog messages.
* @package App\Helpers
*/
class LogProcessor {
public function __invoke(array $record): array {
$record['context']['request_url'] = Request::fullUrl();
$record['context']['session_id'] = Session::getId();
return $record;
}
}
Now we can edit config/logging.php and add the tap entry to our logging channel:
‘channels' => [
// ...
'daily' => [
'driver' => 'daily',
'path' => storage_path('logs/laravel.log'),
'level' => 'debug',
'days' => 14,
'tap' => [ App\Helpers\LogHelper::class],
],
],
The ability to parse, view, and search logs on the command line is an indispensable skill in the software developer’s toolkit. During everyday development, your application runs locally, and processing things locally in real time is valuable. There are also cases when you must diagnose issues on a remote server, and the same skill set applies.
It’s beneficial to keep a window with your log files open during development. There are several things going on under the hood for even a simple web application. The warnings and notices appearing in PHP error logs are often the first symptoms of something being off in your code, especially when your application doesn’t appear broken at first glance.
This can be easy to do with the tail command (please note I’ve removed timestamps for legibility).
$ tail -f laravel.log
DEBUG: debug {"id":"one,""request_url":"http://my.test.com/one,""session_id":"MvXb0r..."}
DEBUG: debug {"id":"two,""request_url":"http://my.test.com/two,""session_id":"MvXb0r..."}
WARNING: cache miss {"request_url":"http://my.test.com/cached,""session_id":"MvXb0r..."}
One of the easiest way to search for messages is to use the grep command.
$ grep WARN laravel.log
WARNING: cache miss {"request_url":"http://my.test.com/cached,""session_id":"MvXb0r..."}
WARNING: last name undefined {"request_url":"http://my.test.com/profile,""session_id":"MvXb0r..."}
WARNING: first name undefined {"request_url":"http://my.test.com/profile,""session_id":"MvXb0r..."}
WARNING: mobile phone undefined {"request_url":"http://my.test.com/profile,""session_id":"MvXb0r..."}
You can also use grep multiple times to filter out the noise.
$ grep WARN laravel.log | grep -v undefined
[2019-09-08 10:25:43] local.WARNING: cache miss {"request_url":"http://my.test.com/cached,""session_id":"MvXb0rPZSJT3sscLktF07sFetYvSLXEMVa4oLxIg"}
There are occasions when you want to limit a live view of your logs to particular data. For instance, if you wanted to limit lines to a particular session, you could use:
$ tail -f laravel.log | grep MvXb0rPZSJT3sscLktF07sFetYvSLXEMVa4oLxIg
WARNING: cache miss {"request_url":"http://my.test.com/cached,""session_id":"MvXb0r..."}
WARNING: last name undefined {"request_url":"http://my.test.com/profile,""session_id":"MvXb0r..."}
WARNING: first name undefined {"request_url":"http://my.test.com/profile,""session_id":"MvXb0r..."}
WARNING: mobile phone undefined {"request_url":"http://my.test.com/profile,""session_id":"MvXb0r..."}
There are several benefits of using a tool instead of files and command-line utilities. However, the most important is using a tool (or an application) that allows your log management to grow with your application and your team. You can get by with simple utilities on one or two servers and a small team. You can also bet things will get out of hand quickly as you grow.
Loggly® setup requires a few lines of code, and we can use the helper classes we created earlier to streamline the process. All we need is one more class and a little configuration, and we’re on our way.
First, we need a class for pushing the Monolog built-in LogglyHandler into our logging stack.
<?php
// File: app/Helpers/Loggly.php
namespace App\Helpers;
use Monolog\Handler\LogglyHandler;
use Monolog\Logger;
class Loggly {
/**
* @param Logger $config
* @return Logger
*/
public function __invoke($config) {
$logger = new Logger(env('APP_NAME'));
$logger->pushHandler(
new LogglyHandler(
env('LOGGLY_KEY') . '/tag/' . config('services.loggly.tag'),
Logger::DEBUG
)
);
return $logger;
}
}
Next, we need to add our Loggly key to our environment file (.env).
LOGGLY_KEY=ff2337d9-dd24-4030-8c6e-309ae53738db
Then we configure our key and tag in config/services.php.
'loggly' => [
'key' => env('LOGGLY_KEY'),
'tag' => env('APP_NAME'),
],
Lastly, we reconfigure our logging channels.
'channels' => [
'stack' => [
'driver' => 'stack',
'channels' => ['daily', 'loggly'],
'ignore_exceptions' => false,
],
// ...
'loggly' => [
'driver' => 'custom',
'formatter' => Monolog\Formatter\LogglyFormatter::class,
'via' => App\Helpers\Loggly::class,
'tap' => [App\Helpers\LogHelper::class],
],
],
One great feature of Loggly is the ability to generate alerts based on events discovered in your log files. Finding out your application has been down for 30 minutes after being notified by an angry user is never a great experience. Loggly is designed to allow you to define an alert on just about anything you can search for, which is then sent to various endpoints.
For example, you’d definitely want to be alerted if your application encountered a fatal error or an uncaught exception.
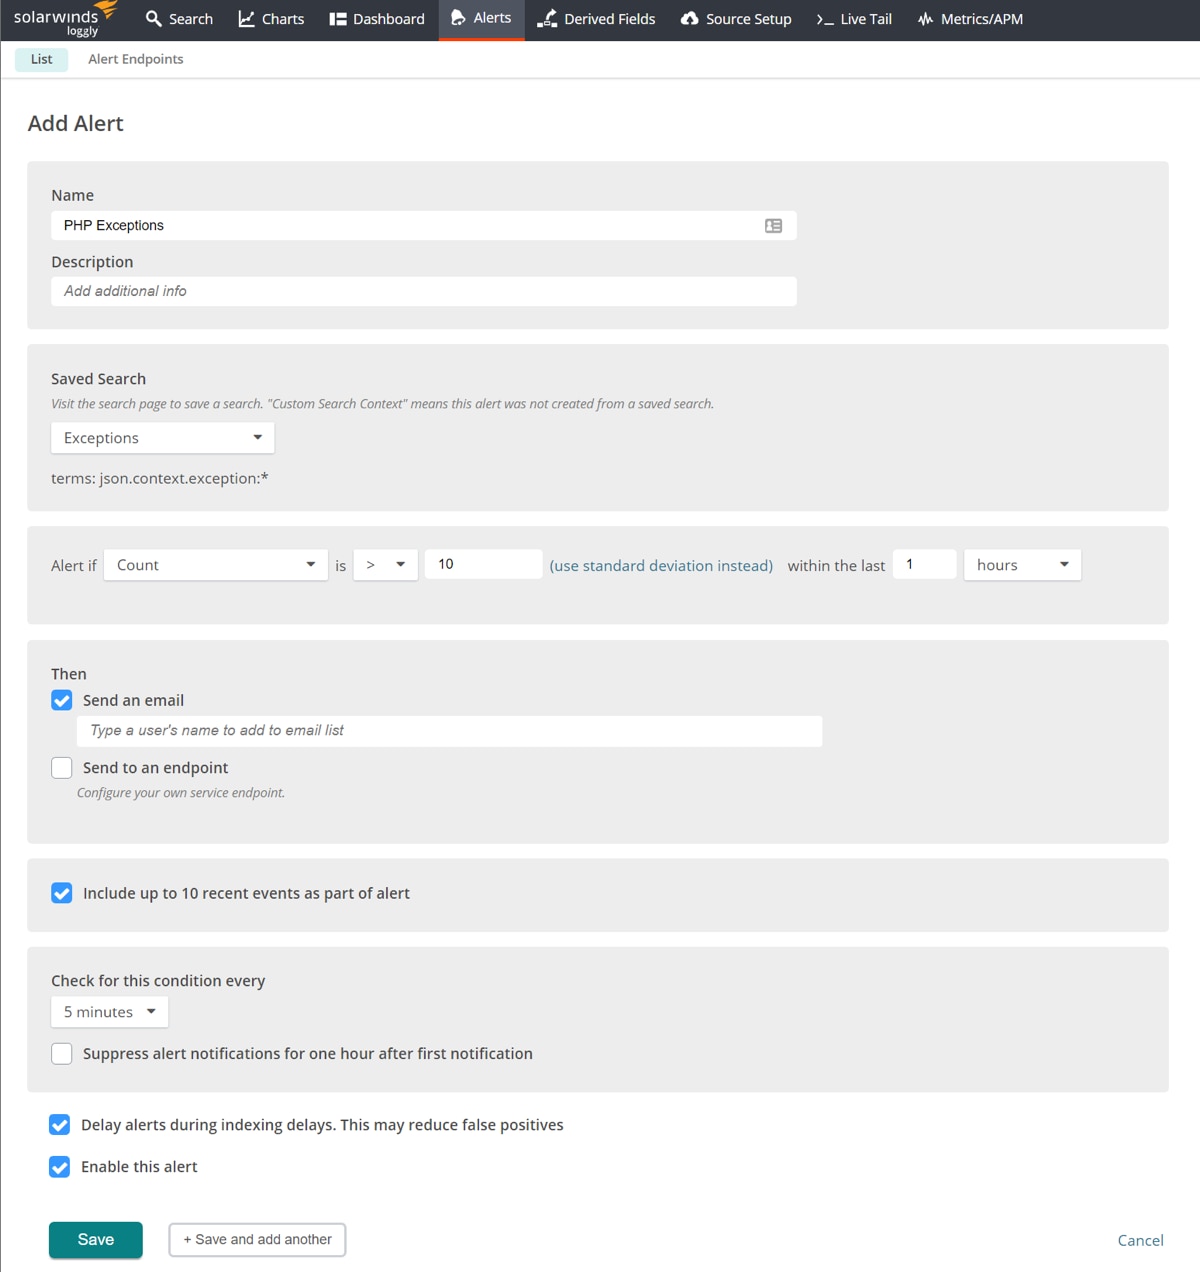
Add Alert to List
Another great Loggly feature is the ability to create graphs based on the statistical data in your log files. The more your application is being used, the more log data it generates, which can make it increasingly difficult to make any sense of the data in your logs. The following is a simple example of a graph, but I leave it to your imagination (and your data) as to what’s possible to create.
This graph is built to visualize the number of occurrences for different exception types. We’re looking at the field json.context.exception.class, which gives us the class thrown in the exception.
You can also save and use the graphs you build to create dashboards, giving you a great bird’s-eye view of application behavior.
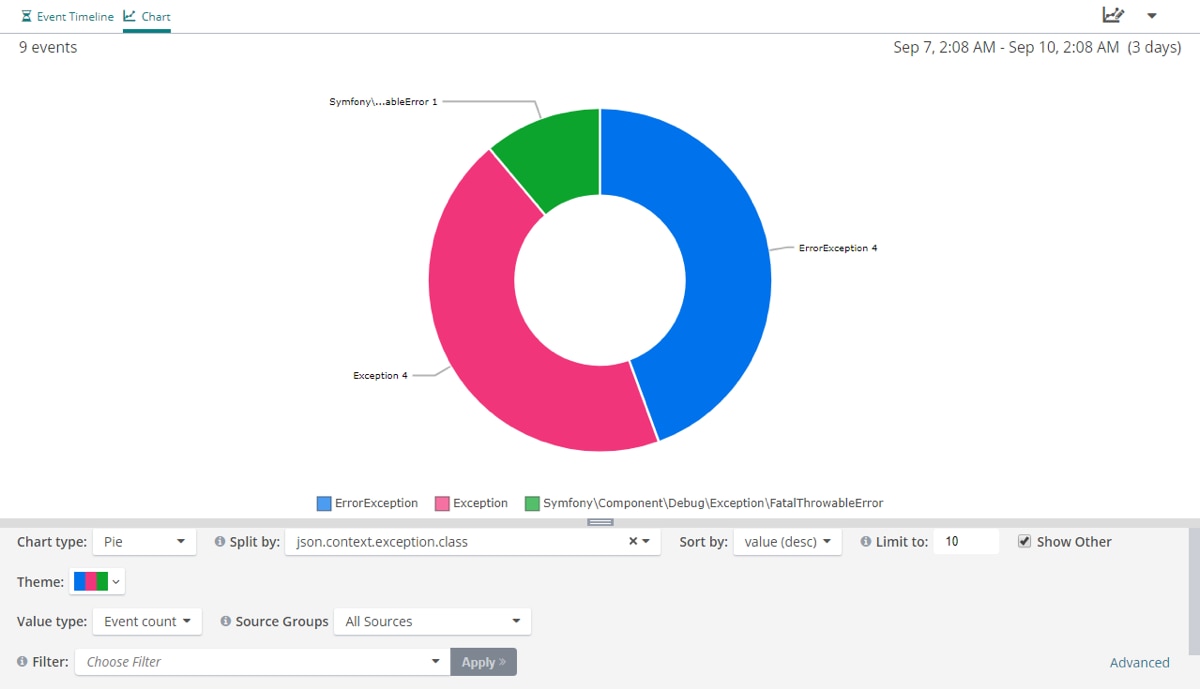
Graphs of Log Statistics
Command-line tools can be pretty useful, but they’re often limited. They can get the job done when you’re working solo on a small or straightforward project with a low number of developers. Once an application grows to a certain point (or if you want to help make your life easier), Loggly can be a much better alternative, as it allows you to aggregate logs from several hosts, which is essential in a load-balanced or multi-tier deployment. It can also index logs for rapid searching, which is key when dealing with higher log volumes in a production environment. With Loggly, analyses and custom alerting combine, which can give you access to new insights about how your software behaves and how your customers use your application, along with real-time notifications for errors requiring your attention.
Last updated: 2022