Technical Resources
Educational Resources
APM Integrated Experience
Connect with Us
At some point, every Node developer will have to troubleshoot production issues in their applications or APIs. That’s why knowing how to debug your application is so important. With so many tools and techniques available, it’s hard to decide where to start your troubleshooting efforts. This quick guide will provide you with a few steps to get your Node app back up and running in production.
Knowing how to troubleshoot your Node applications efficiently makes the difference between your app being down for a few minutes, versus a few hours or days. There are a few things you can try to trace down the error as fast as possible, like identify the steps to reproduce the error. Once you know where to start looking, you’ll find your debugging time decreases because you’ll have a structured approach to hunting down issues in production.
There are several steps you need to take first, regardless of the type of issue you’re seeing. First, find the steps to reproduce the issue in production. If a page is giving users a 404 error after they have correctly filled out a form, see if there are any specific values triggering the error. You can figure out these steps from user descriptions of what happened leading up to the error or by tracing through the call stack. Once you know the steps leading up to the issue, you can start looking into further troubleshooting steps. This will give you a great starting point for making fixes in the code.
One commonly overlooked step—and also one of the easiest to check for—are changes in the production environment. Make sure the connection strings are pointing to production resources, check that you have the right CORS policies in place, and check that your auto-scaling thresholds are appropriate for the production traffic you expect. Look for any version differences between production and your other environments. If you use different configuration values for different environments, check that you have the correct values for production and you aren’t using development credentials. This is the time you should review everything outside of the code to make sure there aren’t any problems with configurations.
To deliver a great user experience, look at the most common errors in the logs. For example, you might find many HTTP 500 errors for internal server errors. This could indicate bad links or routes in other areas of the project. Here’s an example of a status error list you would see in a log management system like Loggly. Using systems like these make it easier to get information quickly because you don’t have to search through log files or console output manually.
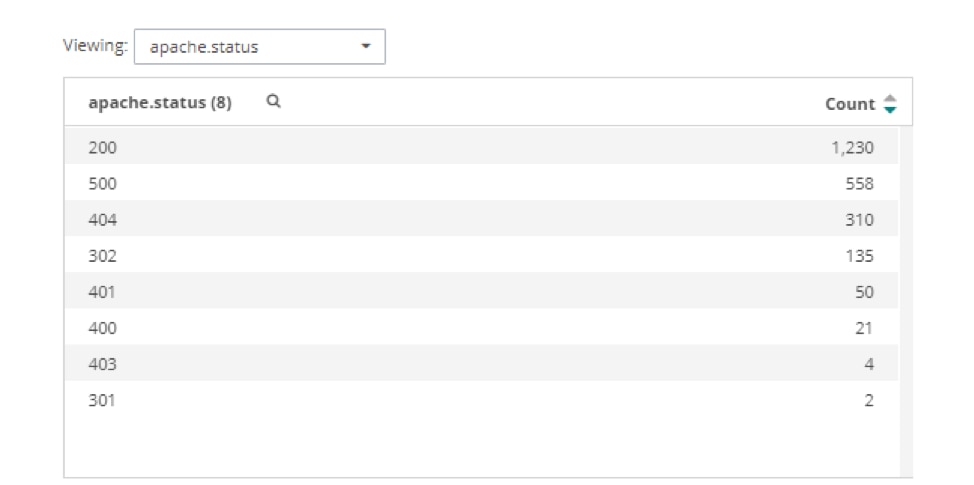
Once you have a list of errors like this, you can look into their details. Looking at all the 500 errors can show you which URLs are causing the problem. That way, you can see if you missed a new file or if there’s a route misspelled in your Node application. For example, we can see below that most of the 500 errors are for a file named “lb.txt”:
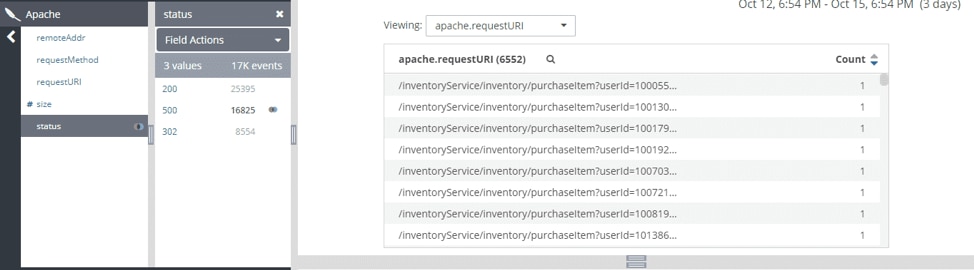
If you need a list of where the error messages are coming from in your Node application, you can check the apache.requestURI with the apache.status set to 500 to see a count of errors you’re getting from your server logging. This will give you a list of the errors you’re logging and details, such as what client sent those errors and what time they occurred. Using this information can help you find the file causing the issue, because you can search through your code base for methods triggering this logging event. Below, we can see the most common error occurs when connecting to the database.

Another issue you might run into is users experiencing slow load times on your website. If that’s the case, you can check the average response time inside your log management dashboard. In the dashboard below, we can see the average response time is about 80ms, and there are no big spikes during this time period.
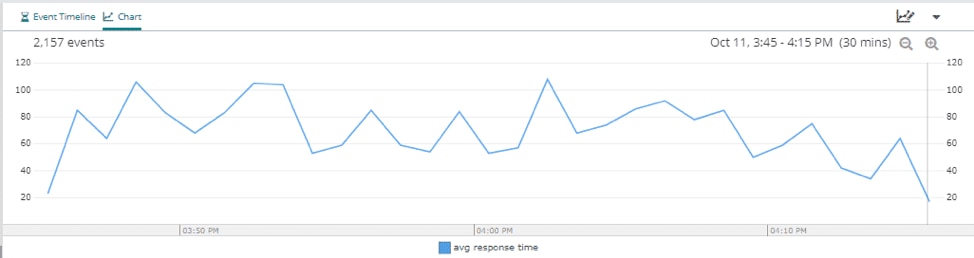
Now that you understand the average response time of the overall system, you can check the average response time for specific IP addresses that can help you pinpoint potential endpoints slowing down the load time for users. This is a way for you to check for any microservices-related issues. One service could have a longer response time than the others, which will slow down any services that depend on its response.
In this example, the resource shown in blue is responsible for most of the latency. If this is unexpected, we could dig deeper into the network configuration for this resource.

Having this kind of information available visually will speed up troubleshooting sessions tremendously, because you can see exactly where the problems are.
Once you’ve made it through a crisis in production, take some time to reflect on how you might prevent it in the future. Is there something in the pipeline you can automate? Are you tracking errors in the correct logs? Look at the root cause of the issue and check for that in other parts of your code. If you can spend the time, consider doing some chaos engineering to help build resilience into your Node application. Troubleshooting a production application quickly takes a strategy, and you can build said strategy starting with the steps we covered in this article.
These are just a few of the steps you can go through while troubleshooting your Node application. It can be stressful debugging issues in production, but having a strategy in place can help prevent any new issues from arising. If you have a recent stable version of the production build, put that in place while you figure out what’s happening. You can also send a note to users letting them know about the issue and that you and the team are working on it. Just remember you’ll get the application up and running faster if you stay calm and walk through the steps, similar to how you would during development.
You can learn how to get more out of your logs in the “Analyzing Node Logs” subsection. Additionally, the “Logging Source Information” subsection provides you with more details on the fields parameter of the options variable.