Technical Resources
Educational Resources
APM Integrated Experience
Connect with Us
Operating system logs provide a wealth of diagnostic information about your computers, and Linux is no exception. Everything from kernel events to user actions is logged by Linux, allowing you to see almost any action performed on your servers. In this guide, we’ll explain what Linux logs are, where they’re located, and how to interpret them.
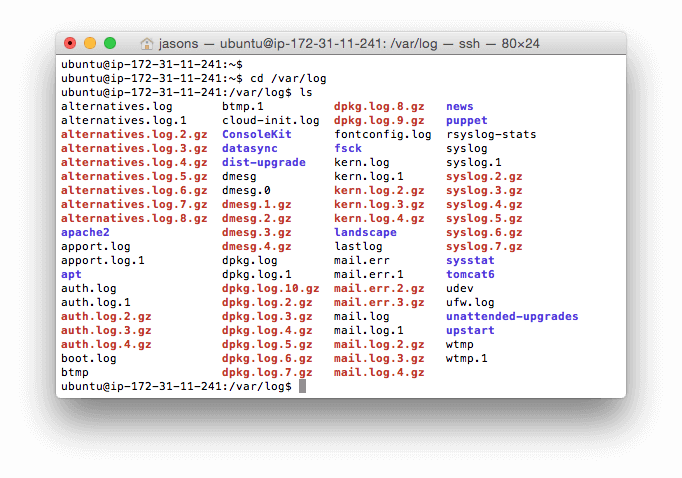
Linux has a special directory for storing logs called /var/log. This directory contains logs from the OS itself, services, and various applications running on the system. Here’s what this directory looks like on a typical Ubuntu system.
Some of the most important Linux system logs include:
/var/log/syslog and /var/log/messages store all global system activity data, including startup messages. Debian-based systems like Ubuntu store this in /var/log/syslog, while Red Hat-based systems like RHEL or CentOS use /var/log/messages./var/log/auth.log and /var/log/secure store all security-related events such as logins, root user actions, and output from pluggable authentication modules (PAM). Ubuntu and Debian use /var/log/auth.log, while Red Hat and CentOS use /var/log/secure./var/log/kern.log stores kernel events, errors, and warning logs, which are particularly helpful for troubleshooting custom kernels./var/log/cron stores information about scheduled tasks (cron jobs). Use this data to verify your cron jobs are running successfully.Some applications also write log files to this directory. For example, the Apache web server writes logs to the /var/log/apache2 directory (on Debian), while MySQL writes logs to the /var/log/mysql directory. Some applications also log via Syslog, which we’ll explain in the next section.
Syslog is a standard for creating and transmitting logs. The word “syslog” can refer to any of the following:
/dev/log, which applications can write to. It can write messages to a local file or forward messages to a remote server. There are different syslog implementations, including rsyslogd and syslog-ng.Since Syslog can forward messages to remote servers, it’s often used to forward system logs to log management solutions such as SolarWinds® Loggly® and SolarWinds Papertrail™.
While RFC 5424 is the current Syslog protocol, it’s not the only standard you’ll see in the wild. RFC 3164 (a.k.a. “BSD syslog” or “old syslog”) is an older syslog format still used by many devices. In practice, admins are likely to see syslog messages that use both RFC 3164 and RFC 5424 formatting.
Good indicators of an RFC 3164 syslog message are the absence of structured data and timestamps using an “Mmm dd hh:mm:ss” format.
Here are some examples of what BSD messages look like, using section 5.4 of RFC 3164 as a reference:
<34>Nov 11 11:11:11 pepeggserver su: 'su admin' failed for user1 on /dev/pts/0
<13>Nov 11 11:11:11 198.51.100.11 Read the docs!
We’ll focus on the newer RFC 5424 protocol here, but keep RFC 3164 in mind if you see messages that don’t conform to RFC 5424.
Syslog messages contain a standardized header with several fields. These include the timestamp, the name of the application that generated the event, the location in the system where the message originated, and its priority. You can change this format in your syslog implementation’s configuration file, but using the standard format makes it easier to parse, analyze, and route syslog events.
Here’s an example log message using the default format. It’s from the SSH daemon (sshd), which controls remote logins to the system. This message describes a failed login attempt:
Jun 4 22:14:15 server1 sshd[41458] : Failed password for root from 10.0.2.2 port 22 ssh2
You can also add additional fields to your syslog messages. Let’s repeat the last event after adding a few new fields. We’ll use the following rsyslog template, which adds the priority (<%pri%>), protocol version (%protocol-version%), and the date formatted using RFC 3339 (%timestamp:::date-rfc3339%):
<%pri%>%protocol-version% %timestamp:::date-rfc3339% %HOSTNAME% %app-name% %procid% %msgid% %msg%n
This generates the following log:
<34>1 2019-06-05T22:14:15.003Z server1 sshd - - pam_unix(sshd:auth): authentication failure; logname= uid=0 euid=0 tty=ssh ruser= rhost=10.0.2.2
Below, you’ll find descriptions of some of the most commonly used syslog fields when searching or troubleshooting issues.
The priority field or pri for short (“<34>” in the example) tells you how urgent or severe the event is. It’s a combination of two numerical fields: the facility and the severity. The facility specifies the type of process that created the event, ranging from 0 for kernel messages to 23 for local applications. The severity ranges from 0 – 7, with 0 indicating an emergency and 7 indicating a debug event.
Pri can be output in two ways. The first is as a single number, prival, which is calculated as the facility field value multiplied by eight; then, the result is added to the severity field value: (facility)(8) + (severity). The second is pri-text, which will output in the string format “facility.severity”. The latter format is often easier to read and search but takes up more storage space.
The timestamp field (“2019-06-05T22:14:15.003Z” in the above example) indicates the time and date the message was generated on the system sending the message. The example timestamp breaks down like this:
The hostname field (“server1” in the example) indicates the name of the host or system that originally sent the message.
The app-name field (“sshd:auth in the example) indicates the name of the application that sent the message.
Many Linux distributions ship with systemd—a process and service manager. Systemd implements its own logging service called journald, which can replace or complement Syslog. Journald logs in a significantly different manner than systemd, which is why it has its own section in the Ultimate Guide to Logging. You can learn more about logging via systemd in the Systemd Logging section.
How to View and Configure Linux Logs on Ubuntu and CentOS (DigitalOcean)
Last updated: 2022