Technical Resources
Educational Resources
APM Integrated Experience
Connect with Us
In this section, we’ll explain the role logs play in .NET application troubleshooting and debugging. We’ll also show how to analyze your logs using various tools and why log analysis tools should be part of every developer’s tool kit.
Logs play a key role in root cause analysis. If your application has a problem, logs can identify the cause and help you find a solution. They contain important troubleshooting data, including error messages, stack traces, and memory dumps. Logs can also provide insights on trends in application behavior. Though manually reading logs can work for smaller applications, large applications can generate thousands of events per second, making manual analysis impossible.
Application problems can result in poor performance, unreliability, and increased downtime. The longer these problems go untreated, the more likely your users will abandon your service for a competitor’s.
Resolving an application problem typically involves these steps:
Now, let’s look at several common troubleshooting techniques using a simple ASP.NET Core minimal web API we’ll create. We’ll look at resolving exceptions, failed transactions, and memory usage. Though the specific problems in your own application might be different, you can apply these techniques to debug problems in your own production application.
For monitoring, we added application logging via Log4Net, Windows Server logging, and log file ingestion via NXLog. We then shipped the logs to SolarWinds® Loggly®, a cloud-based log management solution. You can also manage your logs using the Windows Event Viewer, as shown in the section on searching .NET logs. However, we’ll show below how tools like Loggly make it easier with features such as aggregating across multiple servers and a more comprehensive search.
Demo Application: Counter
Use Visual Studio or VS Code to create an ASP.NET Core minimal web API project named Counter. Our application will support the following use cases:
To keep the application simple, we’ll use an in-memory SQLite database for persisting the data. Additionally, we’ll use the Log4Net integration we covered in the previous article to write information and error logs from the application. Afterward, we’ll stream the Log4Net logs to Loggly. Replace the code in the Program.cs file with the following:
var builder = WebApplication.CreateBuilder(args);
// SQLLite In-memory database for demo only
var connection = new SqliteConnection("Filename=:memory:");
connection.Open();
builder.Services.AddDbContext<CounterContext>(opt =>
opt
.UseSqlite(connection)
.UseValidationCheckConstraints()
);
// Log4net logging
builder.Host.ConfigureLogging(loggingBuilder =>
{
loggingBuilder.ClearProviders();
loggingBuilder.AddLog4Net("log4net.config");
});
var app = builder.Build();
app.MapGet("/counter", async (CounterContext context) => await context.PositiveCounter);
app.MapPost("/counter/increment", async (CounterContext context) =>
{
var pc = await context.PositiveCounter ?? new PositiveCounter();
pc.IncrementValue();
context.SaveChanges();
});
app.MapPost("/counter/decrement", async (CounterContext context) =>
{
var pc = await context.PositiveCounter ?? new PositiveCounter();
pc.DecrementValue();
context.SaveChanges();
});
// Prepare database
using (var scope = app.Services.CreateScope())
{
var dbContext = scope.ServiceProvider.GetRequiredService<CounterContext>();
dbContext.Database.EnsureCreated();
}
app.Run();
We now have an API with the following endpoints:
We require a class named PositiveCounter that stores the counter value, and we enable increment and decrement operations on it. Create the class with the following specification:
namespace Counter;
public class PositiveCounter
{
public int Id { get; private set; } = 1;
[Range(0, int.MaxValue)]
public int Value { get; private set; }
public void IncrementValue()
{
Value += 1;
}
public void DecrementValue()
{
Value -= 1;
}
}
Finally, create a class named CounterContext. This enables you to manage connections with the database, create models and relationships, perform CRUD operations on the data, and manage transactions. Populate the class with the following code:
namespace Counter.Database;
public sealed class CounterContext : DbContext
{
private readonly ILogger<CounterContext> _logger;
public CounterContext(DbContextOptions options, ILogger<CounterContext> logger)
: base(options)
{
_logger = logger;
}
private DbSet<PositiveCounter> PositiveCounters => Set<PositiveCounter>();
public Task<PositiveCounter?> PositiveCounter => PositiveCounters.SingleOrDefaultAsync();
protected override void OnModelCreating(ModelBuilder modelBuilder)
{
_logger.LogInformation("Preparing model");
modelBuilder.Entity<PositiveCounter>(builder => { builder.HasData(new PositiveCounter()); });
}
}
Update the Counter.csproj file to include the necessary NuGet packages:
<ItemGroup>
<PackageReference Include="EFCore.CheckConstraints" Version="6.0.0" />
<PackageReference Include="Microsoft.Extensions.Logging.Log4Net.AspNetCore" Version="6.1.0" />
<PackageReference Include="Microsoft.EntityFrameworkCore" Version="6.0.7" />
<PackageReference Include="Microsoft.EntityFrameworkCore.Sqlite" Version="6.0.7" />
</ItemGroup>
You can test the application now using tools such as Postman. Remember, the data will be lost once you terminate the application since we’re using an in-memory database.
ASP.NET Core has made significant changes to how unhandled errors are presented to end users without divulging information unnecessarily. If the application is running in the development environment, the default ASP.NET Core template will show you the complete stack trace so you can fix the application. In other environments, a generic error is shown, but you can customize the behavior of the error handler in a number of ways, as described in the Microsoft guide.
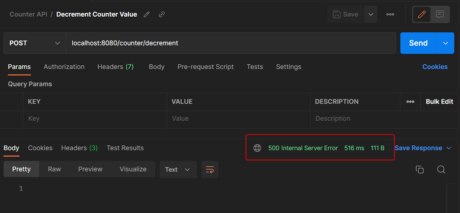
Currently, our application doesn’t handle errors. Based on the value of the ASPNETCORE_ENVIRONMENT environment variable, you’ll either see the stack trace (when the value is Debug) or no information (when the value is Staging or Production) when you try to debug the application:
We can change the behavior of the exception handler by adding an error handler middleware to the request processing pipeline. Create a class named CustomExceptionMiddleware and populate it with the following code:
public class CustomExceptionMiddleware
{
private readonly ILogger<CustomExceptionMiddleware> _logger;
private readonly RequestDelegate _next;
public CustomExceptionMiddleware(RequestDelegate next, ILogger<CustomExceptionMiddleware> logger)
{
_logger = logger;
_next = next;
}
public async Task InvokeAsync(HttpContext httpContext)
{
try
{
_logger.LogInformation("Received request: {Path}", httpContext.Request.Path);
await _next(httpContext);
_logger.LogInformation("Processed request: {Path}", httpContext.Request.Path);
}
catch (Exception ex)
{
_logger.LogError(ex, "Error captured by middleware. Request path: {Path}", httpContext.Request.Path);
await HandleExceptionAsync(httpContext);
}
}
private static async Task HandleExceptionAsync(HttpContext context)
{
context.Response.StatusCode = (int)HttpStatusCode.InternalServerError;
await context.Response.WriteAsJsonAsync(new { Message = "Application encountered an error." });
}
}
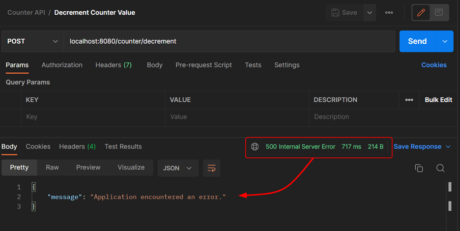
The exception handler wraps the downstream request handlers and prints a custom response when an exception occurs. It logs the exception as well, which we can later use to debug the application.
Register the middleware in your application by updating the code in the Program.cs file as follows:
app.UseMiddleware<CustomExceptionMiddleware>();
Launch the application again and try to decrement the value of the counter to bring it below zero. You’ll see a new response from the application:
Follow the Loggly guide to send the Log4Net logs to Loggly. In our case, it requires making just two simple changes to the application:
LogglyAppender supplied by the package to your log4net.config file. After the update, your config file should look like the following:<?xml version="1.0" encoding="utf-8" ?>
<log4net>
<root>
<level value="ALL" />
<appender-ref ref="LogglyAppender" />
</root>
<appender name="LogglyAppender" type="log4net.loggly.LogglyAppender, log4net-loggly">
<rootUrl value="https://logs-01.loggly.com/" />
<inputKey value="<Loggly token>" />
<tag value="counter-app" />
</appender>
</log4net>
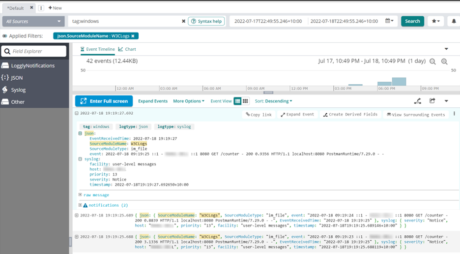
Launch the application again and allow it to generate a few logs and the exception. You can find the information and error logs with the full stack trace available on the Loggly console:
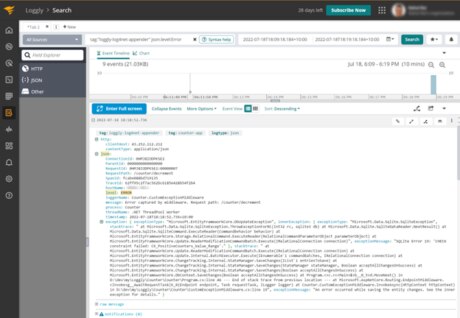
Using the exception.stacktrace field, we can see the problem occurs on line 46 of the Program.cs file when invoking the SaveChanges method on the context object. We still need to do more information gathering and debugging to find out what parameters are causing the error, but we now know exactly where to start.
To learn more about logging exceptions in .NET, read How Logging Exceptions in C# Gets You Ahead.
A failed transaction occurs when a request can’t complete successfully. By default, ASP.NET Core uses Kestrel, which is a highly scalable and performant in-process web server. If a request fails, Kestrel will respond with an HTTP status code of 4XX for client-side errors and 5XX for server-side errors. Kestrel uses the application’s ILogger to log diagnostic data. You can read more about the diagnostics in Kestrel in the Microsoft documentation. If we search Loggly for json.loggerName:"Microsoft.AspNetCore.Hosting.Diagnostics", we can find out the status of each transaction. We can also do a search within the message text to find which transactions recently failed, where they failed, and what the user was trying to do by using the filter: json.loggerName:"Microsoft.AspNetCore.Hosting.Diagnostics" json.message:"*500*".
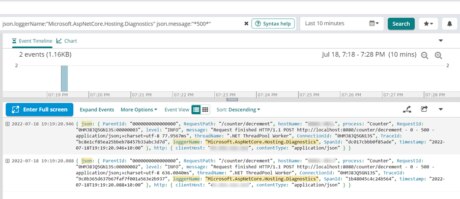
Searching for HTTP code 500 in Loggly.
Seeing when and what types of errors are being generated is a good start, but let’s look deeper to find the root cause.
Errors typically result from a series of actions performed by a user. When debugging, you may need to work backward from the error to the cause. Doing this by hand is time-consuming, but tools like Loggly make it easy to trace an application’s flow across multiple log events.
IIS and Kestrel can provide rich logs of requests, as we saw in the previous section. You can further enrich this information by using the W3CLogger in ASP.NET Core. The W3CLogger writes to files on the server, which we can gather from the server through the NXLogs and Loggly integration for Windows Server.
To enable W3C logging, edit the Program.cs file to register the W3C logging services in the DI as follows:
builder.Services.AddW3CLogging(logging =>
{
logging.LoggingFields = W3CLoggingFields.All;
logging.FileSizeLimit = 5 * 1024 * 1024;
logging.RetainedFileCountLimit = 2;
logging.FileName = "CounterW3CLogs";
logging.FlushInterval = TimeSpan.FromSeconds(2);
});
Next, add the W3C logging middleware to the WebApplication object:
app.UseW3CLogging();
With the configuration, the middleware writes logs in the form of text files in a folder named logs. The following NXLog config will consume the log files and send them to Loggly. Note the paths and Loggly tokens used in the file will be different for each person.
Panic Soft
#NoFreeOnExit TRUE
define ROOT C:\Program Files\nxlog
define CERTDIR %ROOT%\cert
define CONFDIR %ROOT%\conf\nxlog.d
define LOGDIR %ROOT%\data
define LOGFILE %LOGDIR%\nxlog.log
LogFile %LOGFILE%
Moduledir %ROOT%\modules
CacheDir %ROOT%\data
Pidfile %ROOT%\data\nxlog.pid
SpoolDir %ROOT%\data
<Extension json>
Module xm_json
</Extension>
<Extension syslog>
Module xm_syslog
</Extension>
# Watch W3C Log files
<Input W3CLogs>
Module im_file
#Supply the location where your log files are stored
File "D:\\dev\\my\\Loggly\\Counter\\Counter\\logs\\CounterW3CLogs*.txt"
SavePos TRUE
Exec $event = $raw_event;
Exec to_json();
</Input>
<Processor buffer>
Module pm_buffer
#100Mb disk buffer
MaxSize 102400
Type disk
</Processor>
<Output out>
Module om_tcp
Host logs-01.loggly.com
Port 514
Exec to_syslog_ietf();
Exec $raw_event =~ s/(\[.*])//g; $raw_event = replace($raw_event, '{', '[PLACEHOLDER FOR LOGGLY TOKEN tag="windows"] {', 1);
</Output>
<Route 1>
Path W3CLogs => buffer => out
</Route>
You search the logs in Loggly using the `tag:Windows` search expression, as we configured NXLog to apply this tag to every log it exports to Loggly.
For even greater traceability, Log4Net contexts let you create and automatically append fields to log events using name-value pairs. Contexts are especially useful for web applications because they can store unique identifiers—such as a user, session, or request ID—for each request. You can then search on a specific identifier’s value to view all related logs.
Some problems require more data than logs can provide. There are several tools you can use for advanced debugging—including Azure Monitor for live applications—as well as Perfmon and Log Viewer for local development.
Microsoft Azure is a complete cloud computing environment for running applications, databases, virtual servers, and other assets. Using Azure Monitor, you can collect and analyze logs, metrics, and other telemetry data to effectively monitor and troubleshoot cloud resources. Azure includes several solutions for searching and analyzing this data, including Application Insights for metrics and Log Analytics for logs.
For more advanced analysis, you can also stream your logs to a service like Loggly.
For more interactive troubleshooting, you can also use Visual Studio to remotely debug Azure apps. You can set breakpoints, monitor memory usage, and view running processes. However, this can lower performance and even prevent the app from responding to requests. Therefore, this method is best used on non-production deployments.
Windows includes a performance monitoring tool (Perfmon.exe) built to run on Windows Server or desktop. It displays real-time metrics of .NET applications, including CPU usage, memory usage, and compiler performance. You can view combined metrics for an entire system or metrics for a specific .NET application instance.
To start Perfmon.exe, open the Start menu, type “Performance Monitor,” and click the first result. By default, Perfmon.exe shows CPU usage for the host. Let’s say we want to monitor our application’s memory usage. Click the “Add” button in the toolbar and expand the “Available counters” drop-down menu. Expand “.NET CLR Memory,” then select “# Bytes in all Heaps.” In the Instances list, select the process under which your application is running. Click Add, then click OK.
In this screenshot, we’ve added two additional metrics: Total committed Bytes (in green) and Total reserved Bytes (in blue). We then started the application around 2:09:50 p.m., which is indicated by the sudden increase and stabilization in all three metrics.
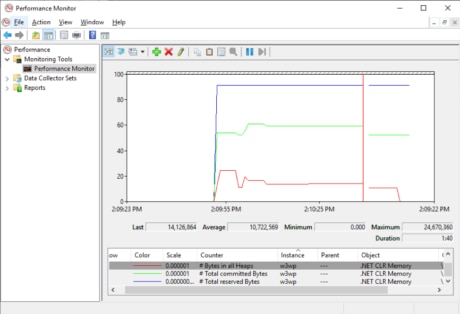
Monitoring the performance of an ASP.NET application. © 2019 Microsoft Corporation. All rights reserved.
These metrics can be accessed from within .NET, making it possible to include metrics in your logs.
To monitor your servers remotely and see aggregated metrics across your entire cluster, use an application performance monitoring (APM) solution such as SolarWinds AppOptics™.
Logger and LogViewer are local Windows debugging tools designed to record every function and API call made by an application.
Logger is a lightweight debugger built to attach itself to a process and output calls to a file on the desktop. The file lists each function call with the time it was performed. You can choose which types of events to log and which modules to include or exclude from logging. You can then open this file in LogViewer to trace the application flow, search for specific calls, or export the file to plain text.
Logger’s main limitation is it can’t attach to existing processes and must start the application itself. It can also cause programs to behave differently or crash unexpectedly. However, it’s useful as a standalone debugger for quickly troubleshooting applications.
Last updated: 2022