Technical Resources
Educational Resources
APM Integrated Experience
Connect with Us
Apache logs provide essential information about your web operations, including server performance metrics, traffic volume, and errors. Monitoring these logs can help you optimize your web server and web applications, troubleshoot problems faster, and identify unusual events such as surges in traffic. This can lead to better website performance and a better experience for your users.
This section shows different methods of monitoring and analyzing Apache logs.
The most common way to enable file monitoring is by installing and configuring rsyslog. rsyslog is a complete syslog server with built-in file monitoring. It’s designed to be easy to configure, fast and supports log rotation, which is commonly found in Linux distributions such as Ubuntu.
The following rsyslog configuration monitors both the Apache access and error logs. You may need to replace the file names depending on your configuration.
module(load="imfile" PollingInterval="10")
# Apache access file:
input(type="imfile"
File="/var/log/apache2/access.log"
Tag="apache-access"
Severity="info")
# Apache error file:
input(type="imfile"
File="/var/log/apache2/error.log"
Tag="apache-error"
Severity="info")
Save this to your rsyslog configuration file, then restart the rsyslog service.
$ sudo service rsyslog restart
Some vendors have scripts or agents that will configure rsyslog to monitor these log files, making setup easier. For example, SolarWinds® Loggly® built a script that can automatically configure rsyslog to monitor your Apache logs.
Alerts are immediate notifications that give you a chance to proactively fix issues before too many customers are impacted or report support issues. Unfortunately, a few Linux distributions don’t have convenient alerting tools, but you can try to build your own using cron jobs or postfix. Even better, log management services like SolarWinds Loggly can continuously check your logs to see if an alert should fire and can notify you right away.
Here are some great alerts to consider for Apache. The search examples use the Loggly syntax, and you can find suitable thresholds by looking at trends during your peak site usage periods.
| Description | Search | Threshold |
| Your error rate is too high | apache.status:>400 | >100 in the last 15 minutes |
| Your traffic is much higher than normal | logtype:apache | >1000 in the last 15 minutes |
| Your site is much slower than desired | apache.requestTimeMillis:>1000 | >200 in the last 15 minutes |
Here are some tips on setting up Apache alerts.
Dashboards are a great way to stay on top of what’s happening on your site, as told by your Apache logs. Linux command line tools often don’t offer good graphical dashboards, but there are log management systems with excellent built-in capabilities. Here are some dashboards to set up for Apache, with an example screenshot showing each below.
Apache status over time tells you if there is an unexpected increase in traffic or error rate.
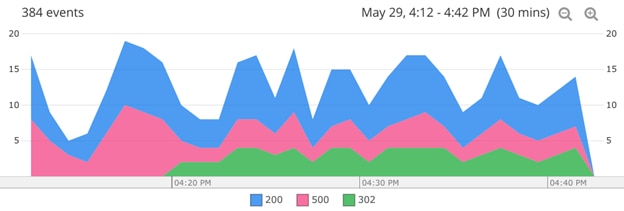
Line chart showing HTTP request status over time. © 2019 SolarWinds, Inc. All rights reserved.
Apache response time tells you if response times are slow due to servers getting overloaded or new code deployments. In the trend view, select timeline chart, a numeric field of apache.requestTimeMillis, and the operator is Average or Max.
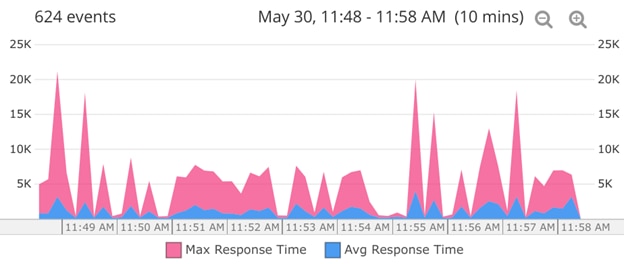
Line chart showing the maximum and average request time for Apache requests. © 2019 SolarWinds, Inc. All rights reserved.
Apache traffic by IP tells you if traffic issues are overwhelmingly caused by one or a small number of clients.
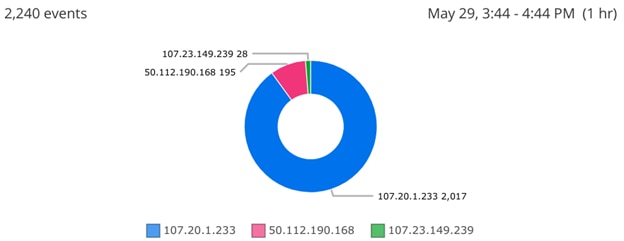
Pie chart of requests according to the source IP address. © 2019 SolarWinds, Inc. All rights reserved.
Top error URIs tell you which URIs have the most errors.
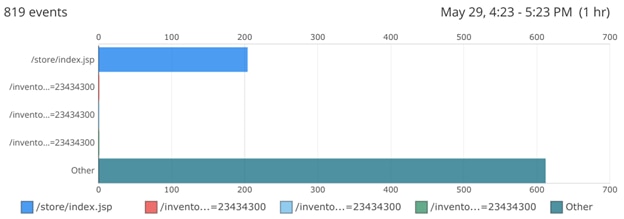
Bar chart of error requests according to the URI. © 2019 SolarWinds, Inc. All rights reserved.
Last updated 2022