Technical Resources
Educational Resources
APM Integrated Experience
Connect with Us
Extracting useful information from your log files is critical to the success of your Java application. Log data will give you valuable insight into your application’s performance, stability, and usability.
Analyzing log data might seem tedious, but it doesn’t have to be. There are a variety of tools for reading, parsing, and consolidating log data. Basic command-line tools such as grep, uniq, and sort can combine and extract useful information from log files. More advanced log parsers such as Logstash or Fluentd can extract key data from your logs into easily searchable tokens. Cloud-based logging services such as SolarWinds® Loggly® store your log data for you and offer sophisticated analysis capabilities, eliminating the need to maintain logs yourself.
This section explores some methods and tools for analyzing logs with the goal of improving your applications.
Finding the most common exceptions can help you pinpoint areas of poor performance in your Java application. Most logging frameworks record the type of exception, the exception message, and the method in which the exception occurred. Using Log4j, a log of exceptions will look like one of the following.
09:54:44.565 [main] ERROR Log4jTest.MathClass - java.lang.ArithmeticException: / by zero
10:00:10.157 [main] ERROR Log4jTest.Log4jTest - java.io.FileNotFoundException: myFile (No such file or directory)
10:00:10.157 [main] ERROR Log4jTest.Log4jTest - java.io.FileNotFoundException: newFile (No such file or directory)
If your output includes stack traces, see the Parsing Multiline Stack Traces section of this guide.
Let’s start with a simple example using the popular GNU tool grep. Then, we’ll show how a log management tool can make it even easier.
The following Unix command will find exceptions, extract the exception type, and count the number of occurrences. grep is a popular command-line tool designed to perform pattern matching, and uniq and sort group and sort the results, respectively:
$ grep -o "\w*Exception" myLog.log | sort -r | uniq -c
In this example, the regular expression \w*Exception matches any word ending with “Exception”. The -o flag tells grep to print only the parts of the output matching the search string. sort -r sorts the result in reverse order, and uniq -c groups the results and counts the number of occurrences. As a result, we end up with a count of exceptions by type.
2 FileNotFoundException
1 ArithmeticException
We can also use grep to search the log for each specific instance of these exceptions.
$ grep ArithmeticException myLog.log
09:54:44.565 [main] ERROR Log4jTest.Log4jTest - java.lang.ArithmeticException: / by zero
This returns each line containing an instance of the search string ArithmeticException, with the search string itself highlighted in the output.
You can also search for exceptions by the class in which they occurred. For single-line log events, the following command groups the number of exceptions by class and by type. grep extracts the class name by searching for a word followed by a particular character (this example uses a hyphen, although any character can be used as long as it’s unique to the entry). Though this character isn’t essential, it helps us locate the class name in the log event. With the OR operator (denoted by |), grep will also extract the name of the exception by searching for a word containing the string “Exception”.
sed is another command-line utility you can use to format output from grep. In this example, sed removes the special character from our output as well as any new-line characters. The output is then piped to the uniq and sort commands to respectively group and sort the results.
$ grep -o "w* -|\w*Exception" myLog.log | sed 'N; s/ -n/ /' | sort -r | uniq -c
The result brings us closer to the key problem areas:
2 Log4jTest FileNotFoundException
1 MathClass ArithmeticException
With these results, we can use grep to find more details about problems occurring in specific classes. For example, the following command retrieves exceptions that occurred in the MathClass class.
$ grep -e "MathClass.*Exception" myLog.log
09:54:44.565 [main] ERROR Log4jtest.MathClass - java.lang.ArithmeticException: / by zero
Most log management solutions can offer ways to group and search log entries based on log type, message content, class, method, and thread. If your logs are already being parsed and stored, many solutions can graph and sort exceptions by the number of occurrences. This is a point-and-click operation in Loggly, which means you don’t need to memorize complicated grep commands. Loggly can also index the log records and isbuilt to make searches and counts much faster than grep. For example, we can use the Loggly Dynamic Field Explorer™ to see a list of exceptions and their frequency and then click on an exception to view all relevant logs.

Using the Loggly Dynamic Field Explorer to quickly find logs by exception type.
Loggly also offers visualization tools that can be more informative than the text-based output from grep. Graphs like this can help you prioritize resources for development sprints or for patches following a new release.

Charting exceptions by frequency in Loggly.
When it comes to production problems, time is of the essence. A critical error in your application won’t just leave your users unhappy; it’ll also lower sales and reduce trust in your application or service.
In most cases, resolving a problem can be broken down into three key steps:
The first step is to collect information about the problem. Gather as much information as possible—screenshots, crash reports, logs, links (for web services), etc.—to help narrow down potential causes. You’ll want the user who experienced the problem to provide detailed information about the event, including when and where in the program the problem occurred, his or her actions leading up to the problem, the operating environment, and any strange or unusual behavior from the program before and after the problem occurred.
From there, you can start gathering log information. If your application is a hosted service, start retrieving logs from the web and application servers. If your application is a distributed software package, ask the user to include log data in his or her bug report. Alternatively, if your application sends log events to a centralized log server, your logs will be immediately available.
Once you have a reasonable amount of data regarding the issue, you can begin tracking it down in code.
After collecting information about the problem, the next step is to identify its cause. Reproducing a bug in a development environment is one of the easiest ways to validate its existence, but it can be time-consuming and may not work in all cases. Having a thorough set of logs will bring you straight to the source of the problem, saving you time and frustration.
A bug report will give you a general idea of what the problem is and where it occurred. Using your log management tool of choice, you can narrow down your search to a smaller range of log entries by searching for a unique data token such as a username, session ID, or message text.
Let’s run through an example scenario to demonstrate how to debug a system. Imagine we have a web-based interface for remotely logging in to a website. The webpage has a login screen designed to perform basic authentication using a username and password. Users have been reporting they can’t log in to the website. The webpage accepts their input but then fails with a generic error.
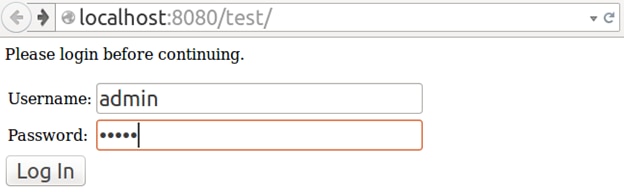

A sample website reporting an error after a login attempt.
This message doesn’t give us much information other than a generic indication of the log’s severity. Searching through a log manager for entries with “Severe” in the level or message could result in hundreds of results with no guarantee any of them are related to the issue at hand. Fortunately, our logger also recorded the username of the user who experienced the error, so we can filter on the “admin” username.

Viewing a Java exception in Loggly.
If we drill down, we see the cause of the error is a missing or invalid table. This is a serious problem, as it could indicate an accidental deletion or database corruption.
ERROR: Exception for user admin
com.mysql.jdbc.exceptions.jdbc4.MySQLSyntaxErrorException: Table 'test_schema.users' doesn't exist
...
com.mysql.jdbc.StatementImpl.executeQuery(StatementImpl.java:1651)
at TestApplication.Test.doPost(Test.java:33)
at javax.servlet.http.HttpServlet.service(HttpServlet.java:646)
at javax.servlet.http.HttpServlet.service(HttpServlet.java:727)
at...
Looking through the stack trace, we see the service failed on line 33 of Test.java. This line consists of a SQL statement pulling data about a user from the test_schema.users table.
rs = stmt.executeQuery("SELECT * FROM test_schema.users WHERE username = " + username + " AND Password = " + password);
When we try to run this query in a SQL front end, we find the test_schema.users table doesn’t exist. However, the database does have a test_schema.user table. At some point, a developer might have mistakenly typed the wrong table name and pushed the revised form to production. Now we know what the issue is and where it appears in our code.
Using SolarWinds Loggly, you can debug and find the root cause of problems by tracing errors through your application stack across multiple log events and even pinpointing the relevant line of code in GitHub.
Now that we’ve identified the problem and its cause, the final step is to fix it. Our login example was an exaggerated case with a relatively easy solution, but you may come across more complicated bugs rooted in different areas of your application. Before jumping for the quick and dirty fix, carefully consider how your change will impact the application. Is this really the best solution for the problem? Is it possible your change will interfere with another component? Will this fix make it difficult to introduce new fixes or features further down the road? Will this fix also prevent similar issues from cropping up later?
For instance, what if two different users managed to create two separate accounts with the same username and password? You could enforce a unique username for all users, but how would that affect your database structure, your authentication code, and your existing user base? You could add a new unique field such as an email address and make it required, but what if some of your current users haven’t supplied email addresses? What if some email addresses are shared across multiple accounts? How will these new rules affect your registration, search, and administration pages?
You’ll also want to consider the delay between creating a fix and deploying it. In an enterprise environment, your code will need to be reviewed by other developers, integrated into the code base, built, tested by QA, staged, and maybe go through several more steps before it hits production. Your company may have specific protocols for critical or time-sensitive bugs you need to follow. Once you’ve found a solution, include your resolution in your documentation as well as any reasonable workarounds to the problem. This way, your customers can still use your product, and your support team can reduce the number of duplicate bug reports while the fix makes its way to production.
After deploying the fix, continue monitoring your production application to verify the issue was resolved. For example, after deploying the fix for the database issue in the above example, we should no longer see events with “Table ‘test_schema.users’ doesn’t exist.” If the errors continue or if we start seeing new errors, we know the fix didn’t work. Ideally, we’ll see a pattern like the one shown in the following screenshot, where the number of errors drops to zero immediately after we deploy the patch.
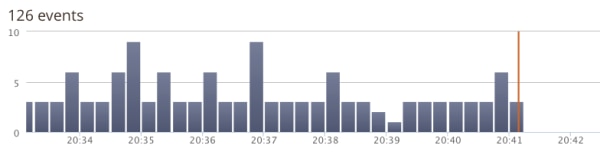
Charting the number of logs containing an error in Loggly.
Though logging is often the tried-and-true method of troubleshooting and debugging applications, these tools can help you gain more insight into how your application operates.
jdb, the Java Debugger, is a command-line utility for debugging Java classes. jdb can be easy to use and comes bundled with the Java Development Kit. Using jdb creates a new Java Virtual Machine (JVM), allowing you to debug a class without affecting any running programs. You can also use jdb to debug running applications by adding the following parameters to your java command:
-agentlib:jdwp=transport=dt_socket,server=y,suspend=n
When the JVM starts, it assigns a port number for incoming jdb connections. You can then attach it to the running JVM instance using jdb -attach:
$ jdb -attach
You can use this, for instance, to connect your debugger to a running production instance. Be careful with using breakpoints in this scenario since it could pause an active thread. This can have consequences if, for example, a customer is using the application while you’re debugging it.
OverOps is a suite of tools for monitoring applications, analyzing code, and detecting issues. Unlike logging software, which relies on output generated by a running application, OverOps is built to connect directly to the Java Virtual Machine to map out the application’s code base, read variables, and record errors. This can allow it to catch more errors and record more data than even the application’s logging framework. OverOps uses a software as a service (SaaS) model, where metrics are collected and stored on the OverOps cloud servers. However, you can also deploy it on-premises. In either case, you can view your data using a web-based interface.
BTrace is a tracing tool built to let you monitor all aspects of your application, from class names to errors. BTrace uses an aspect-oriented programming approach involving the use of annotations, which specify where and how BTrace monitors your application. For example, the following BTrace script monitors and logs every call to the javax.swing package.
import com.sun.btrace.annotations.*;
import static com.sun.btrace.BTraceUtils.*;
@BTrace public class AllMethods {
@OnMethod(
clazz="/javax\\.swing\\..*/",
method="/.*/"
)
public static void m(@ProbeClassName String probeClass, @ProbeMethodName String probeMethod) {
print(Strings.strcat("entered ", probeClass));
println(Strings.strcat(".", probeMethod));
}
}
For more information about BTrace, see the BTrace GitHub repository and Wiki.
jhsdb (Java HotSpot Debugger) is a suite of tools for debugging, analyzing, and profiling the default JVM provided with both OpenJDK and the Oracle JDK. jhsdb lets you attach to running Java processes, take snapshots of stack traces, and even analyze crashed JVMs. You can use it to access the heap, code cache, garbage collection statistics, and more. To learn more, see the jhsdb documentation page.
When a problem occurs, it’s important to know where the issue started and how it affected the rest of your application. This is difficult enough in a monolithic application, but it becomes even harder in a distributed service-oriented architecture, where a single request may hit dozens of services. It’s not always obvious which service contains the root cause of the error or how it affected other services. Tracing provides the data needed to follow the execution path of your application and can help you drill down to the exact cause of a problem.
In this section, we’ll show how tracing transactions played a central role in resolving the problem.
To trace a sequence of log events, you need some way of uniquely identifying related logs. A multi-user environment could generate hundreds of identical logs, making it difficult to search based on timestamp or logger. An easier solution can be to include a unique identifier with related log entries. This identifier could be a username, a session ID, an API key, or a Universally Unique Identifier (UUID). Fortunately, ThreadContext is perfectly suited for this job.
In the Debugging Production Problems example, we had a web-based user interface hosted in a Tomcat servlet, which connected to a MySQL database. Users entered their credentials on the webpage, and after pressing submit, the servlet ran a query comparing their credentials against those stored in the database. If the user was successfully authenticated, they were redirected to the main page. If an error occurred, details about the error were logged and the users were presented with a generic message.
We were able to debug this problem by including the users’ usernames in the log message. This allowed us to quickly search for log events related to the admin user. Building off this same example, we can use ThreadContext.put() to map a username to a logger. When the users submit their credentials, the servlet enters the doPost() method, which adds the users’ usernames to the ThreadContext:
public void doPost(HttpServletRequest request, HttpServletResponse response) throws IOException, ServletException {
ThreadContext.put("username", request.getParameter("username"));
logger.info("Entering doPost().");
...
}
Using Log4j with the pattern %p [%X{username}]: %m%n results in the following entry:
INFO [admin]: Entering doPost().
We can add similar events for accessing the MySQL database, leaving the doPost method, and performing other actions. This way, if the user triggers an exception, we know exactly what the user was doing when the exception happened.
Many logging frameworks provide native methods for tracing an application’s execution path. These methods vary slightly between frameworks but follow the same general format.
traceEntry() marks the beginning of a method.traceExit() marks the end of a method. For methods returning an object, you can simultaneously return the object and log the event with returnexit(object).throwing() marks an exception unlikely to be handled, such as a RuntimeException.catching() marks an exception not going to be rethrown.You can find framework-specific information on these methods in the logger documentation for Log4j, Logback, and java.util.logging.
As an example using Log4j, we’ll replace the Logger.info() methods in our servlet with tracing methods.
public void doPost(HttpServletRequest request, HttpServletResponse response) throws IOException, ServletException {
logger.entry();
...
logger.exit();
}
We’ll also change the Appender’s PatternLayout to show the class name, method, and line number (the %class, %M, and %line conversion patterns).
<PatternLayout pattern="%p %class %M %line: %m%n" />
Tracing methods log events at the TRACE level, which means we’ll have to change the logger’s level from DEBUG to TRACE. Otherwise, the log messages will be suppressed.
<Loggers>
<Root level="trace">
<AppenderRef ref="Console"/>
</Root>
</Loggers>
TRACE DatabaseApplication.Login doPost 26: entry
...
TRACE DatabaseApplication.Login doPost 59: exit
Tracing methods also provide their own Markers. For example, the Logger.entry() and Logger.exit() methods display ENTER[ FLOW ] and EXIT[ FLOW ] respectively.
ENTER[ FLOW ] 14:47:41.074 [main] TRACE DatabaseApplication.Login - Enter
EXIT[ FLOW ] 14:47:41.251 [main] TRACE DatabaseApplication.Login - Exit
SLF4J users can take advantage of MDC to trace log events. Like Log4j, MDC values can be used with an Appender using the %X conversion pattern.
SLF4J also provides entry(), exit(), throwing(), and catching() methods through the XLogger (Extended Logger) class. You can create an XLogger instance using XLoggerFactory.getXLogger().
package DatabaseApplication;
import org.slf4j.Logger;
import org.slf4j.LoggerFactory;
import org.slf4j.ext.XLogger;
import org.slf4j.ext.XLoggerFactory;
public class Login extends HTTPServlet {
final static XLogger xlogger = XLoggerFactory.getXLogger(Login.class.getName());
final static Logger logger = LoggerFactory.getLogger(Login.class.getName());
@Override
public void doPost(HttpServletRequest request, HttpServletResponse response) throws IOException, ServletException {
xlogger.entry();
..
xlogger.exit();
}
}
Add the %class and %line conversion patterns to logback.xml.
<configuration>
<appender name="Console" class="ch.qos.Logback.core.ConsoleAppender">
<encoder>
<pattern>%-5level %class{36} %M %L: %msg%xEx%n</pattern>
</encoder>
</appender>
<root level="trace">
...
</root>
</configuration>
The resulting log entries are identical to those created by Log4j.
Memory management is often overlooked in higher-level languages such as Java. Though the average amount of memory in modern devices is increasing, high memory use can have a big impact on your application’s stability and performance. Once the Java Virtual Machine can no longer allocate memory from the operating system, your program could terminate and crash. Knowing how to manage memory can help prevent problems as your application grows.
For example, imagine we wanted to store a set of numbers starting from one. A user supplies an upper limit, and the program stores each integer from “1” to that limit. We’ll use a while loop with a counter to add each number to an array.
import java.util.Scanner;
...
System.out.print("Please enter the maximum size of the array: ");
Scanner scanner = new Scanner(System.in);
int limit = scanner.nextInt();
ArrayList intArray = new ArrayList();
int count = 1;
while (count <= limit) {
intArray.add(count);
}
You might have noticed count doesn’t increment in the loop. This is a big problem; if the user enters any number greater than zero, the array will continue to grow until the JVM uses all its available memory and the program crashes.
Exception in thread "main" java.lang.OutOfMemoryError: Java heap space
at java.util.Arrays.copyOf(Arrays.java:2245)
at java.util.Arrays.copyOf(Arrays.java:2219)
at java.util.ArrayList.grow(ArrayList.java:242)
at java.util.ArrayList.ensureExplicitCapacity(ArrayList.java:216)
at java.util.ArrayList.ensureCapacityInternal(ArrayList.java:208)
at java.util.ArrayList.add(ArrayList.java:440)
at MemoryTest.main(MemoryTest.java:10)
To reduce memory usage, the Java Virtual Machine performs a periodic cleanup process known as garbage collection. Garbage collection seeks out blocks of memory no longer in use and makes them available for reuse. The following resources explain Java’s garbage collection process in greater detail.
The garbage collector generates diagnostic information useful for performance profiling applications. You can log this information by passing -Xlog:gc to the JVM when starting your application. After each run, the garbage collector prints statistics about the garbage collection process in the Unified JVM Logging format. Here’s an example:
[0.009s][info][gc] Using G1
[0.024s][info][gc] Periodic GC disabled
[0.313s][info][gc] GC(0) Pause Young (Normal) (G1 Evacuation Pause) 7M->1M(64M) 8.450ms
Using G1 says which garbage collection method is being used. The Garbage-First (G1) collector is often enabled by default on multiprocessor computers with large amounts of RAM. Periodic GC disabled indicates that the garbage collection process won’t repeat. The third line tells us this is an Evacuation Pause, where objects are copied between memory regions based on whether they’re still in use. Pause Young tells us the process cleaned the young generation, which is where new objects are allocated. As a result, total memory usage by objects in the young generation dropped from 7M to 1M out of 64M allocated, and the process took 8.450ms.
With the garbage collector printing diagnostic information to the console, we can see how the amount of allocated memory (the heap size) continues to grow over time. We’ll remove the CPU times for simplicity.
$ java -Xlog:gc MemoryLeakDemo
[0.006s][info][gc] Using G1
[0.027s][info][gc] Periodic GC disabled
[0.146s][info][gc] GC(0) Pause Young (Concurrent Start) (G1 Humongous Allocation) 25M->23M(64M) 4.372ms
[0.148s][info][gc] GC(1) Concurrent Cycle
[0.202s][info][gc] GC(1) Pause Remark 50M->34M(64M) 0.250ms
[0.272s][info][gc] GC(1) Pause Cleanup 94M->94M(124M) 0.057ms
[0.318s][info][gc] GC(1) Concurrent Cycle 169.695ms
[0.328s][info][gc] GC(2) Pause Young (Concurrent Start) (G1 Humongous Allocation) 94M->94M(124M) 3.738ms
[0.328s][info][gc] GC(3) Concurrent Cycle
...
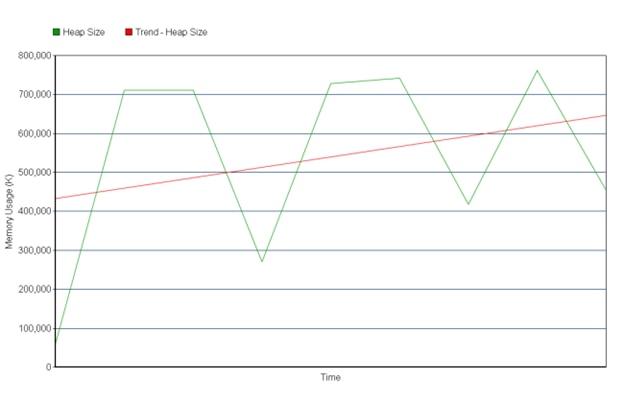
Chart showing a gradual increase in JVM heap usage over time.
You can add time stamps to each entry with -XX:+PrintGCDateStamps and -XX:+PrintGCTimeStamps. You can also log the garbage collector’s output to a file by passing —Xlog:gc:file: to the JVM when starting your application.
If you monitor your log files with rsyslog, you can then forward the logs to a centralized logging system where they’ll be parsed and ready for near real-time analysis. Here’s what a timeline graph looks like in Loggly. It shows total heap size as well as the heap size before and after the garbage collector runs.
A memory leak is a situation where a program allocates memory faster than it can release it. One of the easiest ways to detect a memory leak is when your program becomes unresponsive, becomes unstable, or causes OutOfMemoryErrors. In Java, you’ll find more instances of Full GC collections as memory use increases.
You can learn more about the garbage collector’s output and pinpointing memory leaks in the Troubleshoot Memory Leaks chapter of the Java documentation.
Cut Debugging Time Without Writing a Single Line of Code (Loggly)—Guide to using Takipi
The Ultimate Guide: Five Methods for Debugging Production Servers at Scale (High Scalability)—Tools and techniques for debugging production problems
Garbage Collection Tuning Guide (Oracle)—Guide to understanding and fine-tuning Java garbage collection
Last updated 2022