Technical Resources
Educational Resources
APM Integrated Experience
Connect with Us
There are several ways for a website to break, and when it does, you’ll want to have the information needed to bring it back online quickly. If you or your users experience an error, you may want to find out the following:
In this section, we’ll show how you can use your Apache logs to answer these questions and troubleshoot your websites faster.
Apache logs have errors from two sources: the error log and error status codes in the access log. HTTP status codes that are errors are 400 or above (see the overview in the What To Log In Apache section). Most often, people want to see the count of errors, especially in proportion to the overall traffic. If the proportion of errors is too high, you know something’s wrong. First, you have to centralize the logs from all relevant hosts. Then, if you’re using Linux tools, you can run this type of command to parse out the status code, count, and then sort them descending by count:
$ cat access.log | cut -d ' ' -f 9 | sort | uniq -c | sort -nr
941 200
292 500
290 404
50 401
20 400
You can get these counts in a single click, so you don’t have to worry about parsing and counting them yourself. Instead of the above work, it should give quick summaries and visualizations of the error counts in several different formats, such as tables or pie charts. This screenshot was generated from the SolarWinds® Loggly® Dynamic Field Explorer™ and chart creator. Here we can quickly see a large percentage of 403 and 404 responses, which are too many errors.
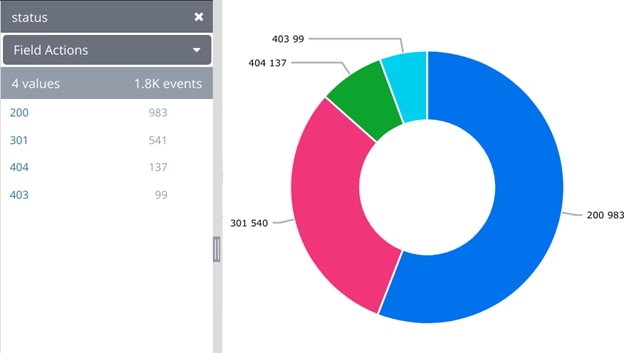
Frequency of HTTP status codes shown in the Loggly Dynamic Field Explorer and as a pie chart.
A 404 error is defined as a missing file or resource. Looking at the request URI will tell you which one it is. You can then check your deployment to make sure a file hasn’t accidentally been deleted or removed. You can add it back in and redeploy the site if it has. If you’re using Linux command line tools, you can use grep to find the 404s, then cut to extract the URL, then uniq, and sort to summarize the list.
$ grep " 404 " access.log | cut -d ' ' -f 7 | sort | uniq -c | sort -nr
17 /manager/html
3 /robots.txt
3 /phpMyAdmin/scripts/setup.php
3 //myadmin/scripts/setup.php
3 /favicon.ico
Some log management systems are built to automatically parse the Apache log lines, allowing you to search or filter down on 404 errors and then summarize a count of the results. In the example below, you can see this as a table or bar chart:
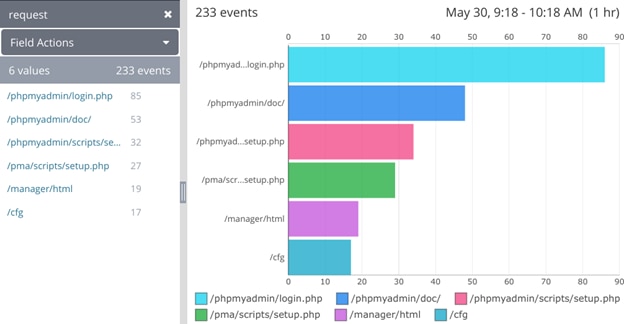
URLs resulting in an HTTP 404 status code as shown in the Loggly Dynamic Field Explorer and as a bar chart.
If you’re running a live site, a feature may often work fine for some browsers but not others. It can be helpful to see the breakdown of errors by browser. For example, if you know you’re dealing with a problem occurring only with Internet Explorer, you’ll prioritize it differently. You can also focus on that browser when troubleshooting. You can get this summary of errors using the Loggly Dynamic Field Explorer by easily filtering your logs on a specific status code (404 or 500, for example) and clicking on the userAgent field. If you’re running an API, it’s helpful to see which client libraries may have issues. The Apache logs can aid in troubleshooting issues with client libraries or agents and also show you which are most popular. When you’re using Linux command line tools, you can extract the top user agents using this type of command:
$ cat access.log.1 | cut -d '"' -f 6 | sort | uniq -c | sort -nr
51 -
47 ZmEu
31 () { :;};/usr/bin/perl -e 'print
14 Apache/2.2.22 (Ubuntu) (internal dummy connection)
11 Mozilla/5.0
Some log management systems can help automatically centralize, parse, and analyze these counts for you and show them in a table or bar chart format. You can see the top user agent here is ZmEu, which is a vulnerability scanner looking for weaknesses in PHP. If we were concerned, a quick solution would be to block the IP in our firewall.
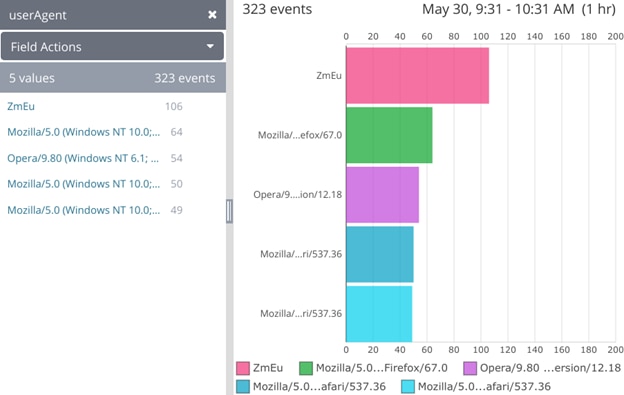
List and frequency of user agents shown in the Dynamic Field Explorer and as a bar chart.
Many users won’t tolerate even a minor slowdown; they’ll get frustrated and complain or stop using your service. It is often a best practice to continuously monitor response times to ensure your server is running fast and its performance is consistent over time. You can do this by tracking the response time captured in your Apache logs. If you have a REST API, the same approach can be used to track the performance of API calls in terms of both speed and consistency. This can help you track and meet SLAs for internal teams or apps relying on your service.
To track load times, it’s helpful to visualize performance as a time series. With some log management systems, you can set this up as a time series chart, which can display statistics like average and maximum over any time window. This helps you see if the issue was a temporary spike. In the example below, you can see the maximum time in blue and the average time in pink. Other options for splitting the chart include by host, so you can see if one host is trending slower than others, or by URI to show your slowest pages or API calls.
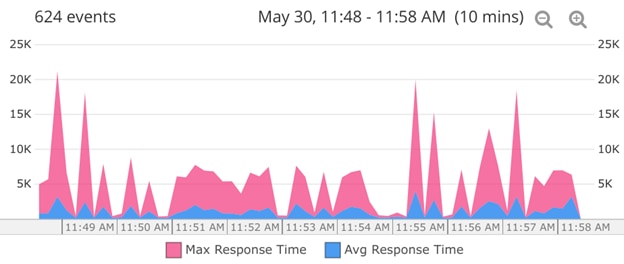
Timeline of the average and maximum request time.
If you have an internal SLA or a maximum response time you want your responses to be served in, you can use a numeric range search to find responses over this threshold. You can build a regular expression to find these in grep or search on it directly if you’re using a log management system. For example, here’s what the search would look like in Loggly:
apache.requestTimeMillis:>500
When your site is under a heavy load, you should know whether it’s from real users or something else like:
It’s pretty straightforward to find an answer from your Apache fields:
An IP address you don’t recognize may be a client with a problem or an attacker. If you don’t want to allow this type of use, you might want to consider blocking or rate limiting this particular IP address. To get this information from Linux command line tools, you can use a command like this to extract the first field, which is the remote IP address:
ubuntu@ip-172-31-11-241:/var/log/apache2$ cat access.log.1 | cut -d ' ' -f 1 | sort | uniq -c | sort -nr
31 91.142.219.68
29 94.102.49.11
28 173.236.125.26
19 222.74.212.77
14 127.0.0.1
A great way to visualize if you’re getting too many requests from one source is a pie chart. Here, you can see one IP is generating more than half of the site’s traffic, which is unusual.
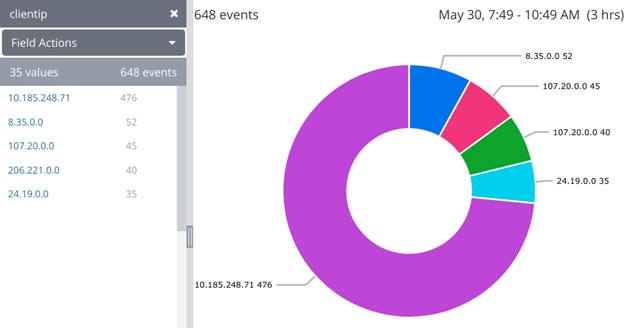
Requests according to client IP address as shown in the Loggly Dynamic Field Explorer and as a pie chart.
You may also want to keep a monitor up and running on your site to look for unusual behavior, possibly indicating a security problem or even potential attacks. For example, game developers need to look out for people trying to cheat or interfere with other players. In this scenario, you want to try to identify behavior patterns users wouldn’t exhibit in real life. There are two big approaches to finding unusual events: top-down and bottom-up. For top-down, look at high-level metrics to see if there are unusual traffic patterns that could compromise your site (such as too many requests from a particular IP). You can watch these on a dashboard or set alerts when critical thresholds are reached.
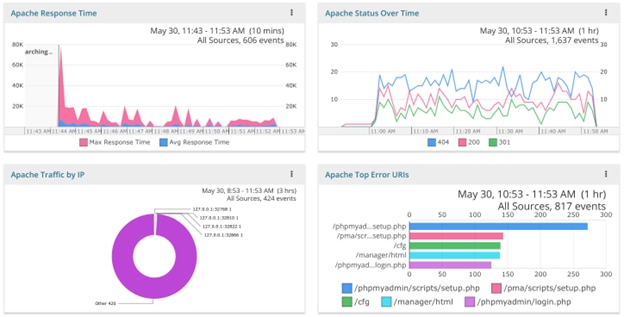
Dashboard of Apache performance metrics, status, traffic, and errors.
For a bottom-up analysis, start by subtracting the legitimate traffic you already know about. Drill down to only the errors. Then within the errors, look at each one to determine the cause. Oftentimes, 80% of the errors are caused by a small number of known problems, so subtract those from your search. Now you can more easily see unusual things like odd user agents or illegitimate URLs. Make sure your site is secure against each of these vulnerabilities. For instance, we saw an example of the ZmEu user agent hunting for PHP vulnerabilities. You should also consider ensuring each URL is returning errors so the scanner is blocked.
$ grep ZmEu access.log.1 | cut -d ' ' -f 9 | sort | uniq -c
47 404
Some log management systems can make this type of analysis as easy as clicking on the ZmEu user agent to drill down on it, then displaying a summary of status codes.
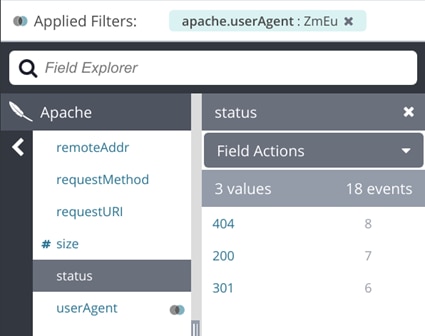
Drilling down to logs related to a specific user agent in Loggly.
Last update 2022